
Friday, March 26, 2010
It ain't pretty, but it works...
I'll probably look back at this some time very soon and realize how bad this really is, but I figured I'd post it anyway. What we have here is the 1st data file collected on the ISX. I basically took the field service guys' test cells (which happened to be fixed K562s) threw a few microliters of PI on them and stuck it on the instrument. No incubation, no RNAse, no knowledge of how the cells were actually fixed (PFA, Methanol, other), no real clue on how to operate the instrument whatsoever. So, you can sort of understand my mild level of excitement that I actually got a somewhat discernible cell cycle profile. I collected the data using the Inspire software, and the shot it over to the analysis computer with the IDEAS program and played around a bit. I did a few screen grabs and made a layout in paint (that's why the resolution of the images is so poor) and displayed it below. If you squint really hard, you can see a G1, G2 and S-phase profile, and then I grabbed a representative image from those 3 groups to confirm they were actually G2 cells. I was even able to do a pretty good job of excluding aggregates. So there you go folks, it works. I guess we'll keep it.

Wednesday, March 24, 2010
ImageStream. Installed.
It seems like years ago we were racing to put together our S-10 to purchase an ImageStream, and yet, it's only been 1 year (almost to the day!). I guess the anticipation has made the wait that much more excruciating. Well, wait no more, the ImageStream is just about installed. The engineers from Amnis arrived on Monday to uncrate and assemble the surprisingly small ImageStream. I should just clarify something right off the bat. The instrument we have is the current generation ImageStream X (not sure what the X means, maybe it stands for X-treme - remember that tag line from the MoFlo XDP...a little dramatic if you ask me). Anyway, I've become fond of the abbreviation, ISX, so that's what I'll be referring to it as. Out ISX has quite the spec sheet; 4 lasers (405nm, 488nm, 561nm, 658nm), two 6-channel CCDs (up to 10 colors, Brightfield and Darkfield), the multimag (magnification from 20X - 60X), and the EDF (extended depth of field). I'm very anxious to get my hands on it. If you'd like to see it in its pre-Ryan Duggan, pristine state, you'd better stop by and take a look at it soon, because one I'm let loose, I have a hard time leaving things alone. I'll try not to break anything for at least a few weeks. We'll be getting our training next week, and then we'll probably start opening it up to users the following week (April 5th). If you think you're ready to go with something on this instrument right away, please contact me and I'll get you on the list ahead of posting the instrument on the scheduler. If you have no idea what the ISX is, check it out here.
Data Transfer post USB
I'm over USB for data transfer. There's the possibility of losing the drive altogether or it becoming corrupt, or in the case of recent happenings, it could get infected with a virus and then transmit said virus to every computer you plug it into. CDs, DVDs, BDs, may not be as hard to use, but it's still physical media that you need to label and store (away from heat and light, hopefully). So, we got to thinking, why can't we do without physical media altogether. We, in the flow lab IM or email ourselves data all the time. Sure there's a limit on the total byte size, but many of our experiments involve small numbers of tubes/small numbers of data points. Enter, the ImageStream. The data from the ImageStream (btw, it's being installed this week...more on that later) is going to be much larger, so when I was writing the grant, I put in some funds to get a full-out server that would allow us to at least FTP data to and from. If I'm already setting that up for the ImageStream, we should be able to use it for all the instruments, and manage data sans removable media across-the-board. So, over the next few weeks, we will be implementing this FTP to Server strategy on all the instruments. The LSRIIs were the test case, and they seem to be working well. I'll be outlining some detailed instructions in the next posts, but basically once you export your FCS files in the normal fashion, just zip the folder and drag it onto the upload shortcut icon the instrument desktop. Then, go to your computer and download your zipped folder of data. For the most part it should be pretty painless. The only difficult part is having an FTP client on your computer that is fairly easy to use. We will be recommending the free, Filezilla program. It runs on Mac, Windows, and Linux, so we can pretty much have 1 set of instructions for everyone, and will be able to troubleshoot, to some degree, problems you may have. For some of you who use other cores on campus (e.g. DNA Sequencing Core) this should be very familiar to you already. If you don't want to use a standalone FTP app, you can set up a handy "network place" on windows, or directly connect to the server on a mac (general instructions to follow). There's always the possibility of using a browser for this, but I'm not a fan, so won't even give instructions for doing that. I will send an email out to the list with the details of the server (server path, usernames, passwords, etc...), and then check back here to get instructions on how to proceed. If you're familiar with using FTP, then the server path, username, and password should be all you need.
Tuesday, January 5, 2010
1-on-1 FlowJo Training Slots
We will have a FlowJo specialist from Treestar out on 1/14/10 and 1/15/10 to assist any FlowJo users with problems/questions regarding flow cytometry analysis. We have set up a resource on the Flow Facility's online instrument scheduler called FlowJo Training. The resource can be found under the Training Courses calendar. A read-only version of the calendar can be found here, but to reserve your slot, you'll need to log in with your username/password. This is a great opportunity for both new users of the software who may need a little personalized help getting started as well as seasoned veterans looking to delve deeper into the vast capabilities of FlowJo. You may reserve the 30 minutes slots (1 hour max) anytime up until 1/14/10. The actual training will take place in the facility's Data Analysis room in Kovler Room 038. Please include in the summary field of the reservation form a description of what you would like help with, so that the trainer can be prepared (e.g. compensation, batch processing). Also, include which version of FlowJo you are currently using (Mac 8.8.6, Windows 7.5, etc...)
Friday, November 13, 2009
Plant Sample Prep for Nuclei Analysis
We don't have too many Botanists coming through the flow lab doors, but occasionally they'll bring in some electric green looking slurry of stuff and want to analyze DNA content or Mitochondrial Membrane Potential. It's really no different setting these samples up on the instrument than any other animal/human sample. But, when they start to ask me questions on how to optimize their sample prep, I'm of little help. From what I understand, the process is much like dissociating any tissue. You use some mechanical (slicing and dicing with a razor) and enzymatic processes to try and isolate the cells from the leaves. Beyond that basic understanding of what's going on, I have little to offer, which is why I appreciate this troubleshooting guide so much. A fella by the name of Paul Kron, from the Department of Integrative Biology at the University of Guelph (Guelph, Ontario, Canada) sent me his top 10 troubleshooting tips for achieving good quality histograms when analyzing DNA content from plant material. There's probably some things in here you'll think are somewhat elementary, but isn't it always those elementary steps that are lacking when things aren't going quite right? A short, easy-to-read guide like this will ensure you've thought about some of the minutia involved in optimizing your DNA profiles from plant materials. A link to the top 10 can be found here: http://www.uoguelph.ca/~pkron/PaulKron/Top_10_FCM_Tips.html.
Monday, November 9, 2009
Do you Kaluza?
Seems like there's quite a bit of news coming out of Miami these past few months, and that is a good thing. Beckman Coulter (coulterflow.com) has released it's offline analysis tool, Kaluza, whose major feature seems to be speed. I've been playing around with Kaluza for about a month now and so I can share a few thoughts. You're probably well aware of the fact that we at the University of Chicago are a FlowJo shop. Nearly all of our users analyze with FlowJo (others use acquisition programs like CellQuest or FACSDiVa to do analysis). We've looked into other packages in the past (namely FCS Express and VenturiOne) but none were as exhaustive in capabilities as FlowJo, so we felt we were getting the most bang for buck in that case. What this basically means is that I pretty much look at all analysis software through a "FlowJo-colored lens." My impressions therefore, are fairly skewed towards that bias. With that being said, here's my first impressions on the windows-only (so sad), late beta version of Kaluza.
First of all, it is aesthetically pleasing to look at and interact with. They successfully pulled off the minimalist/high-tech look and feel of the software. Getting started with the software is easy enough. You load FCS files, apply analysis plots/regions/stats and that's it. I've loaded small (10K cells, 2 or 3 colors) files as well as quite large (5M cells, 10 colors) files. They initially load about as fast as you'd expect, within a few seconds up to 30 seconds, but once they're loaded, you can make adjustments, move gates around, recalculate stats very quickly. Moving around within the software is very snappy. This is a welcomed change of pace from FlowJo, which feels like an eternity when manipulating things like compensation on many large files at once. The second thing about Kaluza is navigation. Things like tabbed analyses, the radial menu, and 'office-like' ribbon menus make performing simple tasks inside the software, well, simple. There are a few things I'm a bit unclear of at this point. Apparently batching stats and pdfs are possible in the software, but i haven't quite figured that out yet. Perhaps now that it is out of beta, and user manuals are being put together, I'll be able to play around with that more. However, it is definitely not as powerful as the batching options in FlowJo (their words, not mine). Also, being from Coulter, the nomenclature of certain things is definitely derived from the clinical world, which takes some getting use to. Panels, Protocols, Tests, are all used in a strict clinical sense, and don't always translate directly to the research world, so figuring out what is what took a bit of effort on my part. I have a feeling, the 1st adopters will probably be Coulter hardware users and disgruntled FlowJo users. The speed of analysis is a tempting feature for potential converts, but I may hold off until version 1.x or maybe 2.0 and see what happens. Until then, if you're just dying to try something new, let me know. I'll probably load the software on one of our analysis computers so people can play around a bit if they'd like. Or, if you'd like to get a demo copy of your own, visit http://www.coulterflow.com/bciflow/kaluza.php and click on demo request.
UPDATE: (From Ernie Anderson, BC) FYI, batching stat and PDF output is pretty easy. Just load the files you want to process and select them in the analysis list. (The usual Windows SHIFT-click, CTRL-click, CTRL-A shortcuts work here.) When you have more than one analysis selected, the display is replaced by several buttons:
"Export statistics from selected" will produce a single file containing the displayed statistics from each analysis. Make sure you're showing the stats you want to display before you export. If you're not picky it's easy to just select all the plots and turn on all the stats.
"Print all sheets from selected" and "Print report sheets from selected" do what they say. If you want PDF output, choose a PDF printer driver. There's one on the program CD if you don't have one already. (Sorry, you didn't get that with the beta.)
Tuesday, October 13, 2009
New "Online" Tools from Coulter... Almost Useful!
If you hop on over to the flow cytometry centric Beckman Coulter portal, aptly named coulterflow.com, you'll see a link to some online tools. Tip #1: These aren't actually online tools. They are downloadable, standalone programs which pull information from the coulter web site as needed. Tip #2: They're pretty crude at this point. I can definitely see the utility they may bring in the future, but as of today, they need a lot of work. So, what are they? One is a fluorescence spectrum viewer, called Spectrios (a little corny, but hey, they're rebranding themselves), and the other is an Experimental Design Tool called Experimental Design Tool, but I've renamed it to ExDT. Spectrios does pretty much what you'd expect it to, but again, it doesn't seem ready for prime-time yet. The good thing about Spectrios is that it's a standalone program, so you don't need an active internet connection to use it.
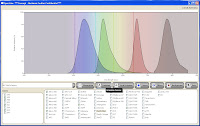
That being said, it's not nearly as good or as informative as the Invitrogen Spectra Viewer or the BD Spectrum Viewer (both online tools, though). Spectrios gives you the basics; Absorption curves, emission curves, laser lines, and filters. It does not calculate theoretical compensation nor allow you to add custom laser lines/filters. It is also lacking many fluorochromes from the list, but surely that will evolve over time. Spectrios and ExDT are so new and unpolished that they even forgot to take off the ***Concept - Beckman Coulter Confidential*** text in the header bar, and as is probably evident by now, these tools are still in Beta (v.0.9.0.7657).
Now here's where things get exciting. ExDT is a tool that will (once it's finished) greatly change the way you design your flow experiments. Built into the design tool are stock instrument configurations (laser lines, filters, # of detectors, etc...) and the entire Beckman Coulter catalog of Antibody/Fluor combinations. So, there are basically 4 steps to walk through (Screen shots below). Step 1 is a basic description of your experiment... Name, date, cell type, descriptions, etc.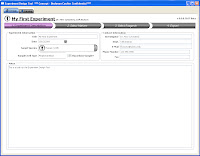 Step 2 allows you to select from the Beckman Coulter online catalog which markers you want to use. Now here's the fun part. As you go through and select which markers you want to use, the panel at the bottom shows you all the available Fluors for the markers, and tells you how many possible combinations can be put together to make your panel. Also, if you wanted to force one of your markers (say CD4) to definitely be PC7, for example, that will automatically narrow your possible combinations greatly. So, if you know that the CD4 PC7 is a really good antibody, and you definitely will use, just Pin the antibody to that fluor, and now you may go from 30 possible combinations to 6.
 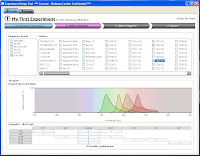 Step 3 then, simply allows you to flip through the possible combination and choose your panel.
 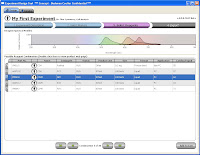 As you flip through the combinations, you get a "Spectrios-like" window showing you the emission curves so you can determine which panel you like based on available filters, or reducing compensation. Does it rank the combinations? Not sure if it does now, but that'd be cool. Does it allow you to upload your own catalog of antibodies? Not sure, but can you say awesome! Does it allow you to input your own instrument configuration with laser lines and filters, and then pick antibody/fluor combos to maximize sensitivity and minimize overlap? No, but if it did, I may faint with excitement. Finally, Step 4 allow you to set up your run list; Single stain controls, FMO controls, Sample tubes, etc... Oh yeah, you can conveniently click the "Add to cart" button just in case you don't have those antibodies on hand and you need to purchase them from "you-know-who." I call that Marketing Genius! Once you've made your run list, you can print it out and send it to your local Flow Cytometry Guru to give his/her blessing, and away you go.
 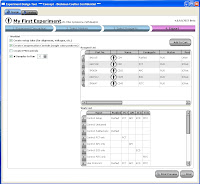 This tool has so much potential, I really wish it was working to its fullest right now. I have all these ideas swirling around my head on how I could use this yesterday. I guess we just play the waiting game now.

That being said, it's not nearly as good or as informative as the Invitrogen Spectra Viewer or the BD Spectrum Viewer (both online tools, though). Spectrios gives you the basics; Absorption curves, emission curves, laser lines, and filters. It does not calculate theoretical compensation nor allow you to add custom laser lines/filters. It is also lacking many fluorochromes from the list, but surely that will evolve over time. Spectrios and ExDT are so new and unpolished that they even forgot to take off the ***Concept - Beckman Coulter Confidential*** text in the header bar, and as is probably evident by now, these tools are still in Beta (v.0.9.0.7657).
Now here's where things get exciting. ExDT is a tool that will (once it's finished) greatly change the way you design your flow experiments. Built into the design tool are stock instrument configurations (laser lines, filters, # of detectors, etc...) and the entire Beckman Coulter catalog of Antibody/Fluor combinations. So, there are basically 4 steps to walk through (Screen shots below). Step 1 is a basic description of your experiment... Name, date, cell type, descriptions, etc.
 Step 2 allows you to select from the Beckman Coulter online catalog which markers you want to use. Now here's the fun part. As you go through and select which markers you want to use, the panel at the bottom shows you all the available Fluors for the markers, and tells you how many possible combinations can be put together to make your panel. Also, if you wanted to force one of your markers (say CD4) to definitely be PC7, for example, that will automatically narrow your possible combinations greatly. So, if you know that the CD4 PC7 is a really good antibody, and you definitely will use, just Pin the antibody to that fluor, and now you may go from 30 possible combinations to 6.
  Step 3 then, simply allows you to flip through the possible combination and choose your panel.
  As you flip through the combinations, you get a "Spectrios-like" window showing you the emission curves so you can determine which panel you like based on available filters, or reducing compensation. Does it rank the combinations? Not sure if it does now, but that'd be cool. Does it allow you to upload your own catalog of antibodies? Not sure, but can you say awesome! Does it allow you to input your own instrument configuration with laser lines and filters, and then pick antibody/fluor combos to maximize sensitivity and minimize overlap? No, but if it did, I may faint with excitement. Finally, Step 4 allow you to set up your run list; Single stain controls, FMO controls, Sample tubes, etc... Oh yeah, you can conveniently click the "Add to cart" button just in case you don't have those antibodies on hand and you need to purchase them from "you-know-who." I call that Marketing Genius! Once you've made your run list, you can print it out and send it to your local Flow Cytometry Guru to give his/her blessing, and away you go.
  This tool has so much potential, I really wish it was working to its fullest right now. I have all these ideas swirling around my head on how I could use this yesterday. I guess we just play the waiting game now.
Subscribe to:
Posts (Atom)