Recently, we've had a pretty good bump in the usage of our ImageStream X (Amnis, now a part of EMD-Millipore), but many of the new users are using the technology to confirm things they're seeing on the conventional flow cytometers. So, needless to say, I've been doing a bit more phenotyping on the ISX instead of the usual nuclear translocation or apoptosis assays that we typically do. In doing so, I was reminded of some comments thrown out by Amnis at the 2011 CYTO meeting saying (and I'll paraphrase) the ISX, and by extension the FlowSight, is the most sensitive cytometer available. The evidence of such a claim was a screen grab of good ole 8-peak beads (Please don't get me started). So, I had some data that I recently collected and thought I'd try and validate those statements with some data that makes sense to me.
It's a really simple example, but in short it involves a surface marker (coupled to PE), a Live/Dead dye (Green) and a Nuclear dye (Violet). By conventional flow cytometry, the PE signal was pretty weak and the user was skeptical that the staining was "real." So, the idea was to make sure the cells were live (Green low/neg), were actually cells (Violet pos) and had surface staining of PE. After going through the normal groups of gating, it came time to look at the PE signal. Surprisingly, it wasn't bad at all (especially with the 561nm laser cranked up to 200mW), however there were some dimmer PE+ cells that were hanging out a bit too close to the negative.
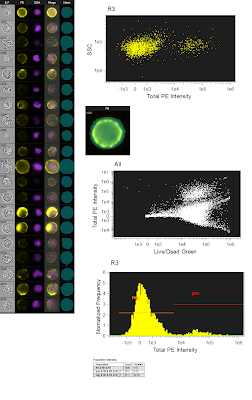
I remember having a discussion with other people in the lab about using carefully calculated masks to pull out the membrane staining and completely removing the cytoplasmic and/or nuclear background which should bring the negative population pretty much down to zero while retaining the specific PE positive fluorescence. This procedure is actually pretty simple so I'll briefly explain it, and if this whole concept of image masking is foreign to you, just think of masks as parts of a cell defined by morphology within which you're going to measure fluorescence. This is very different from flow cytometry where you can only measure fluorescence from the entire cell regardless of where that fluorescence is coming from. With this data, I'm creating a membrane mask, which basically looks like a ring encompassing the outside of the cell. This should retain most of the specific PE fluorescence and remove both background from intracellular autofluorescence, but also background from the nuclear dye and live/dead dye. The figures below demonstrate these findings.
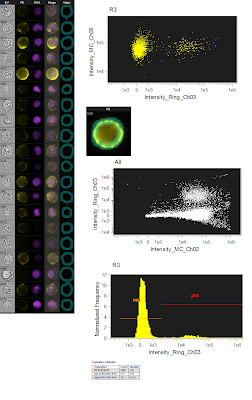
The figure to the left is the originally analyzed data. On the far left is just a gallery of images that show the different fluorescence (the green live/dead wasn't show since dead cells were gated out). The top dot plot is a simple SSC/PE scatter plot to show the distribution of the negative and positives. The image just below is showing the mask used (bluish semitransparent shape overlaying the PE image). Below that is the ungated population showing the Live/Dead Green fluorescence spilling into the PE channel using the whole cell mask. And lastly, a histogram showing the PE Fluorescence. Altogether, a pretty straightforward analysis. However, I wanted to see what would happen if I restricted the PE mask to only the membrane area, so that is what is shown in the figure below. Now, it's important to note that this is the exact same data file, analyzing the exact same group of cells. The only thing changed here is the mask on PE, which is now shown as a ring overlaying the membrane of the cell. If you now look at the SSC/PE scatter plot at the top, you can see the dramatic tightening of the negative population, which implies a reduction of the high autofluorescence cells that were trailing to the right of the negative population in the total cell mask. Another benefit of this restrictive masking strategy was the reduction in the spillover of the green dye into the PE channel as shown in the ungated Live/Dead Green versus PE plot. And lastly, when you look at the histogram, you can see unequivocally the increase in separation between the negatives and positives. To drive the point home a bit more, we can overlay the two histograms so you can see exactly how they match up. Notice that there is a reduction in the intensity of the positive population as well, but this is likely a similar reduction in background fluorescence as is seen in the negative population. The key here and really in all of flow cytometry is RESOLUTION. This is, in fact, what most people are really thinking about when they say 'sensitivity.'
So, can we confirm the original statement here about these imaging cytometers being the most sensitive cytometers available? Well, I'm not sure I'm ready to crown this instrument as the winner just yet, but at least in some circumstances, the ability to only analyze the part of the cell that is actually stained or not stained could prove to be an extremely vital tool especially if you need to resolve dimly stained cells from unstained cells.
A Blog about the world of Image and Flow Cytometry. Coming to you from the core facility at the University of Chicago
Tuesday, October 25, 2011
Thursday, October 13, 2011
Counting Cells with the EMD-Millipore Scepter 2.0
I recently had the chance to play around with the Scepter 2.0 Automatic Cell Counter from EMD-Millipore. The Scepter uses the Coulter Volume principle to count cells in a microfluidic chamber connected to a handheld device. I'm basically using it for things like confirming pre- and post-sort cell counts, as well as counting cells being passaged and primary cells such as PBMCs and splenocytes. The device itself is basically shaped like a pipetteman, and even has a plunger type action which simulates pipetting.
EMD-Millipore Scepter 2.0 |
Scepter Software Pro Screenshot |
Now, about that snafu. What I kept finding was after the sample was loaded into the sensor, and then the sample started traveling through the sensor orifice into the counting micro-channel, I kept seeing bubbles creep in there. The effect of this was I'd start getting these really low volume events piling up near the end of the counting process. It was a small number of low volume events that I could probably gate out (see figure below), but it still messed things up for me. Since I was doing a 1:10 dilution (10ul sample, 90ul buffer), when I back calculate (or better yet, let Scepter Software Pro back-calculate for me) the concentrations, I was off as much as 1x10^6 cells (or a 12% swing in total cell counts). To solve this problem, I made one modification to the collection process. As soon as the sample was loaded into the sensor (it beeps at this point), I immediately flipped the entire Scepter apparatus upside-down as to force any air that begins to enter the sensor to remain near the tip and not enter the orifice and microfluidic channel. This got rid of all the air bubbles and my counts became extremely accurate. In one case, my MoFlo told me there should be 8.02x10^6 cells, and the Scepter counted 8.01x10^6 cells. This made me happy. To see this awesome flip move in action, check out the video below. I apologize for the sound, I was filming this in my sorter room, which has the gentle hum of a twin diesel engine for background noise. Also, you'll just have to trust me when I say "see the bubbles." UPDATE: After playing around with volumes a bit more, it's pretty evident that you definitely need 100+ microliters of volume in your tube. I could get bubbles every time if I only had the requisite 50ul of sample, but if I had 100-120ul, I almost never got bubbles. With this volume, there's no need to turn the scepter upside-down.
So, in all, I think this product was successful for what my purposes were. It's small. The counting process is fast. I can offload the data to my computer, and the counting was very accurate (as long as I remembered to hold it up-side-down to avoid the bubbles). Will I continue to use it? I guess it sort of depends on whether or not I can get over not 'knowing' the %live/dead. For what I'm doing, that's probably fine, but could another option be just as easy and accurate and cheap AND give me live/dead? To be determined. I will say that I've used early versions of the Countess and the Nexcelom, and neither impressed me so much as to make me want to buy one immediately. Hopefully I'll be able to check them out again and perhaps put together a head-to-head review.
Wednesday, October 5, 2011
GLIIFCA 20 Wrap-up.
If you're unfamiliar with the Great Lakes International Imaging and Flow Cytometry Association (GLIIFCA) meeting, you can check out this year's program online here. It's sort of a morph between a technology focused user group meeting and a smaller scale scientific meeting. The focus really is on the utilization of our technology (which I'll refer to under the umbrella term Cytometry) in clinical, translational, and basic research. There is also a strong cytometry vendor presence; about 30 different companies bringing their latest and greatest products. If you'd like to see who attends and supports the association, you can see a list of sponsors on the GLIIFCA site. A part of the meeting that's always a bit disconcerting for me is the Friday night Industrial Science Symposium, which is code-language for "vendor sales pitches." It's been pretty poor some years and not-so-bad others. It really depends on the presentation and the quality of information put forth. You can tell some people are up there literally just trying to sell a product. A good presenter will educate the audience so that the individuals sitting in the chairs come to the conclusion on their own that this is the product they need. And I have to say, we witnessed one of the best examples of this last Friday night in a presentation given by a Chicago-favorite, Kelly Lundsten from BioLegend. Great talk, and actually a pretty good session in total.
The "theme" of the meeting was Cytoinformatics (as opposed to Bioinformatics). As far as the scientific program, it was the first time I found myself thinking, maybe these informatics people aren't wacked. I hear what they're saying, but it usually doesn't strike a chord with me. The basic idea is that you're generating tons of data of various kinds that needs to be quickly integrated in a consistent format in order to support analysis and subsequent decision-making. And I think my resistance has always been in the format of, "Well I don't really generate THAT much data, so I don't have to worry about this stuff." After sitting through a few examples of data generation from some groups that I know pretty well, it got me thinking. The quantity of data can be pretty big even if you're only doing 8-12 parameter flow cytometry or less. This isn't something only for the 18-parameter groups, it's for everyone. Besides the flow data, it would be nice to integrate this info with subject info, imaging info, genomics info, etc.. I think what was pretty successful for this meeting is the fact that it was setup in such a way that you could see the progression of ideas surrounding management of data. 1. Here's the problem: People collect lots of heterogeneous data types. 2. Here's the types of tools needed: Data warehousing, including dimensional models, ETL (extract, transform and load data), and end-user tools to read the relational database. 3. Here are some examples of how people are using these tools with real data and how it impacts decision-making. That was basically GLIIFCA 20, Symposium 1, 2, 3. Kudos to the program committee.
There were also a pretty good crop of posters presented this year, including mine (which won a poster award, thank you very much). Two of them which stuck with me were the "Increased number of laser lines on your cytometer might mess stuff up, so be careful" poster and "Look at this awesome temperature control/antagonist injection apparatus I soldered together with some parts from Home Depot" poster. I'm paraphrasing the titles, of course, and you can find the full poster abstract in the GLIIFCA 20 program linked above. The first one is from the folks just up the road at Northwestern (Geoff Kraker and James Marvin), and the second one comes to us from Roswell Park courtesy of Ed Podniesinski and Paul Wallace. The UCFlow poster was about how "I can't stand looking at QC data, so I'll start using cool Google tools and graphics to make it more interesting and maybe I'll stick with it longer."
So, there you have it. Another year, another GLIIFCA. For the record, this was my 11th GLIIFCA attendance. I have officially attended a majority of GLIIFCA meetings.
A Slide grabbed from Janet Siebert's (Cytoanalytics) Presentation at GLIIFCA 20 |
UCFlow's GLIIFCA 20 Poster |
So, there you have it. Another year, another GLIIFCA. For the record, this was my 11th GLIIFCA attendance. I have officially attended a majority of GLIIFCA meetings.
Subscribe to:
Posts (Atom)