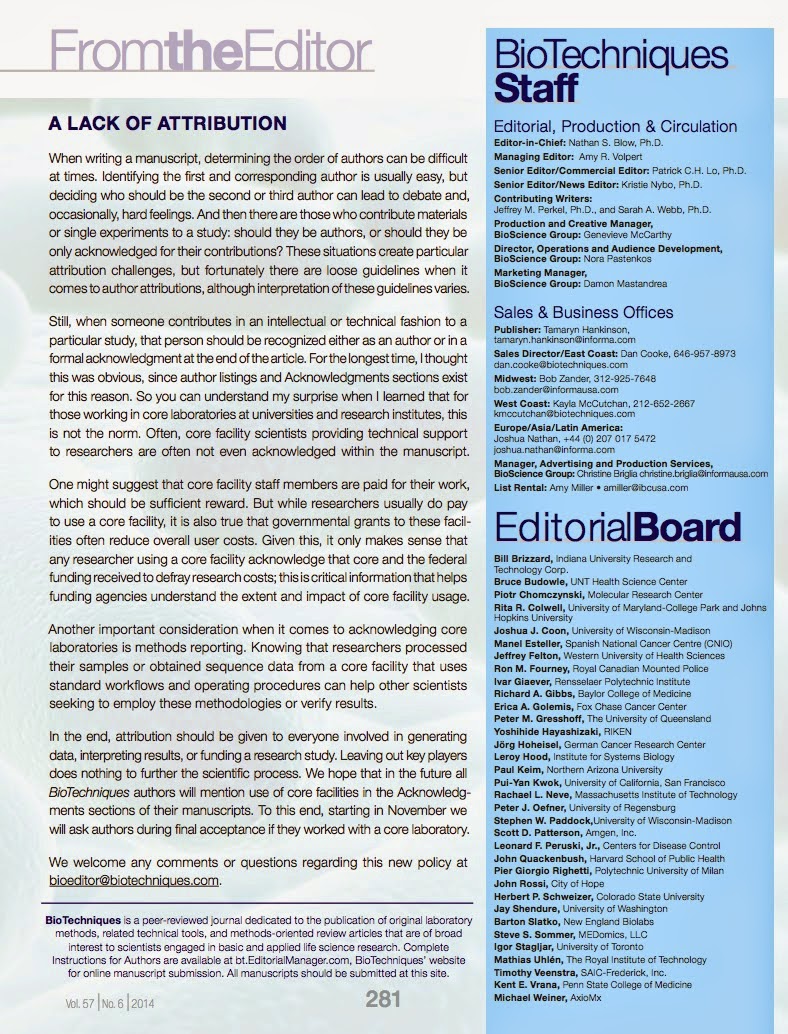
No doubt, many readers are likely in the same position as me. I have BD instruments running FACSDiVa and a bunch of users who know DiVa inside and out. It’s also probably true that you have your favorite set of expletives you rattle off every time you use a BD instrument running FACSDiVa. The tyranny of the default is extremely powerful, and the only way to break through the FACSDiVa wall is to create a cytometer that is a pleasure to use. I always like to say there are only two parts of a cytometer with which an end-user interacts - the software, and the sample loading apparatus. If you can nail these two parts of the instrument, you’ll be able to win over a large part of the community. Conversely, if these components fail from a usability standpoint, you can have the best performing instrument out there, and gain no traction at all in the marketplace. The NovoCyte hits both of these key features pretty well. Their implementation of the autosampler is probably the best I’ve seen to date. It’s smooth, extremely flexible in the types of tubes/plates it accepts, it’s fast enough, and frankly, it just looks cool. In fact, one of the more impressive things about the NovoCyte in general, is its build quality. It's encapsulated in a sturdy metal skin that is completely white with a few touches of color here and there. The doors and cover are secure yet easy and smooth to open. Overall, it has a pretty small footprint, even when you add in the fluidics tray and the autosampler.
The software takes a bit getting use to, but once you understand the workflow, it’s a breeze. You can easily pick up on the design cues implemented in their software - the structure of FACSDiVa, the drag-n-drop of FlowJo, and the ribbon layout of MS Office. It’s friendly enough that you won’t shy away immediately, but it will certainly take you a few minutes to grasp your bearings. The NovoCyte also excels at some other usability features that even surprised a cytometry veteran like me. I especially enjoyed the physical startup/shutdown button on the face of the instrument. This single button not only turns the cytometer on, but also performs the fluidics startup routine before you even turn the computer on. Likewise, when you’re rushing out the door in the evening and you need to shut down the instrument, just click the button once again and it will automagically perform the shutdown routine and power off the instrument. I can’t tell you how many times I’ve rushed through a shut-down procedure skipping as many steps as I could in order to get out the door on time. It’s clear a lot of effort and forethought went into many of these usability features. Is this enough to breakthrough the DiVaDefaultTM? I think it might have a chance, at least.
Fluidics
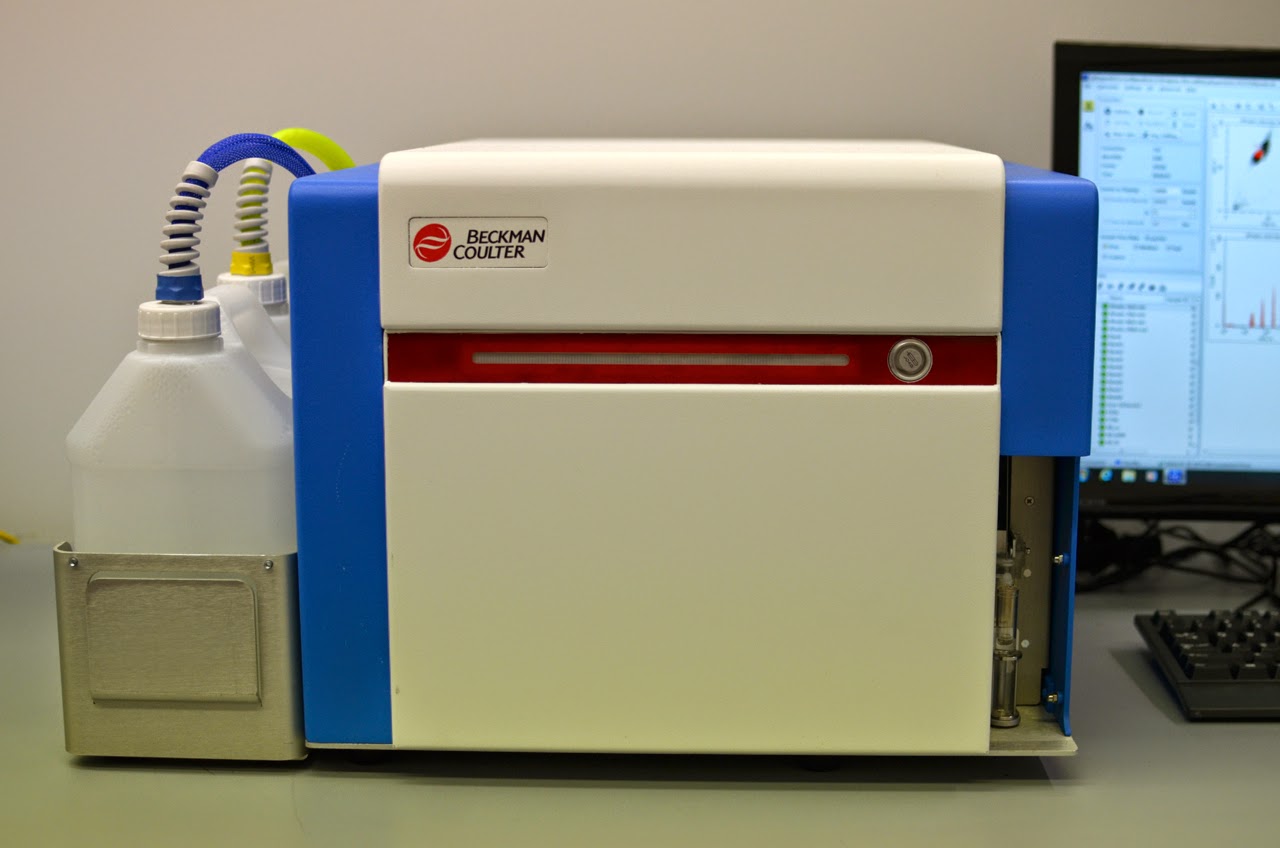
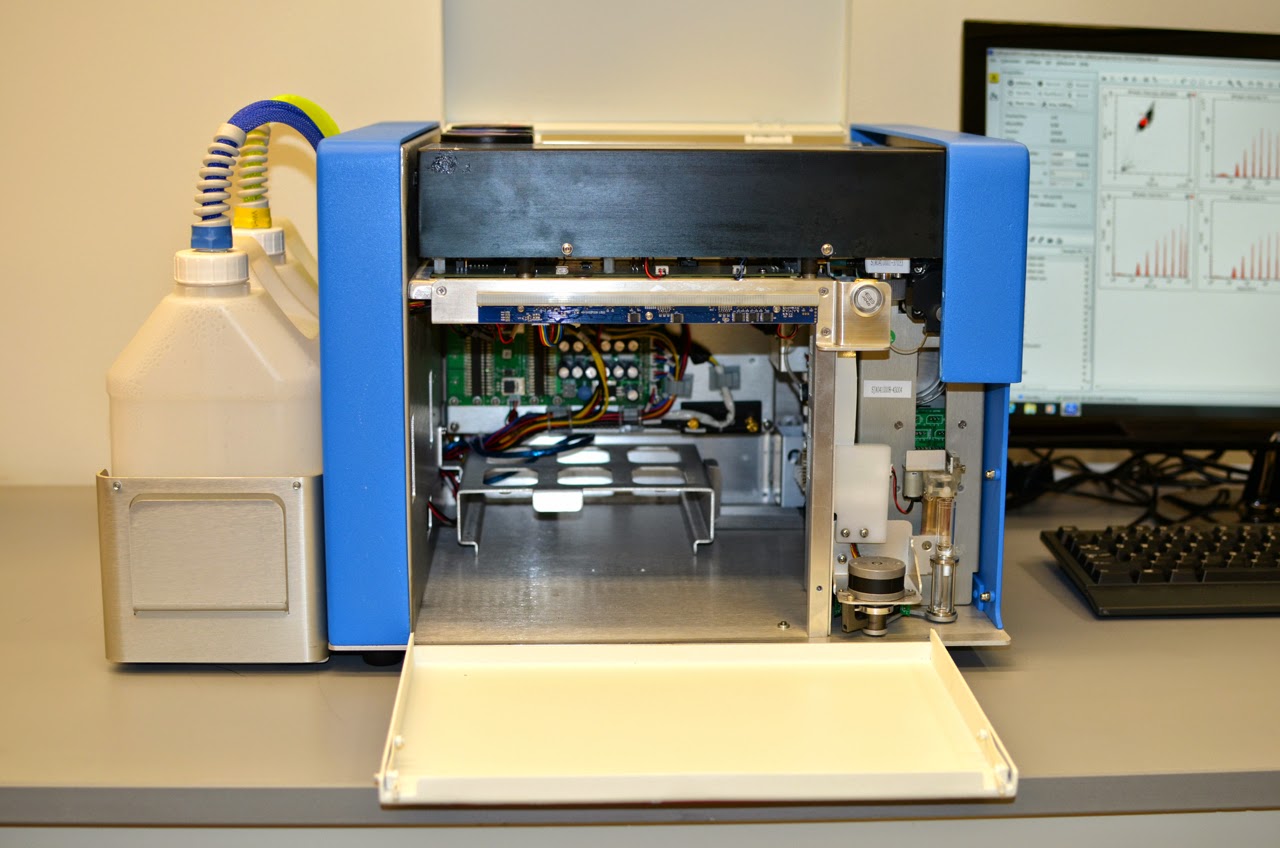
 The NovoCyte’s fluidics is driven by a peristaltic pump on the sheath side of things and a syringe pump on the sample side of things. They obviously got the memo about the need for a pulseless peristaltic pumps since I wasn't able to detect any fluctuations in sample flow during long runs (observing bead intensity vs. time). Also, the syringe allows for volumetric sample delivery and beadless absolute counts. The fluids are stored in a small tray that sits next to the instrument and holds sheath, waste, and a couple bottles of cleaning solutions used during shutdown. The amount of sheath used is relatively small, and although the tank only holds a liter or two, you can easily eek out a full day's worth of sample acquisition using a reasonable amount of between sample washing. Like any syringe based system, the fluidics seem a bit slow; not in terms of volume per unit time, but simply in the operations that need to take place before and after a sample is acquired. The syringe needs to fill, then push its contents though the flow cell, and if you stop prematurely and have extra sample in the syringe, it needs to expel any extra fluid. Syringe pumps also limit how much fluid you can sample at a time. Whereas positive pressure systems and peristaltic pump systems can acquire freely as long as there's fluid in the tube (and beyond!) syringe-based systems are limited in how much volume they can pull. The NovoCyte pulls between 10 and 100uL of volume at a time, likely ok for many applications, but for those who require a larger sample volume, concatenation is your friend.
I would argue the heart of the NovoCyte system is its autosampler, and although it’s not a standard feature of the instrument it’s certainly a must-have add-on in my book. It comes with a 24 tube rack that holds 12x75mm “FACS” tubes as well as a microtiter plate holder. The plate holder can accommodate standard 96 well plates (v, flat, and u) as well as 96 deep-well plates and, my personal favorite, 96-tube rack (1.2mL “bullet” tubes racked in the standard 96 well format). Once you’ve mapped out which wells/tubes you’ll be sampling from, the system affords you true, walk-a-way operation complete with email notifications. Sample flow rate, number of washes and mixing is all programmable to allow you some control over optimizing against carryover or for speed.
As mentioned above, another key usability feature is the system’s one-button startup/shutdown routine. One thing that I like to test on all my instruments is what I call the “cold-start to dots on the plot” time. As the name implies, I’m interested in knowing how long it takes to start the instrument, perform any required start-up routines, run the QA procedure, put on a sample and see dots appear on a plot. For some instruments this can be quite long, sometimes as much as 20-30 minutes. The NovoCyte is extremely fast in this regard. By having a physical button that powers on and performs the fluidics startup, you can do that concurrently with things like logging into the computer, launching the software and preparing for QC. The QC process is bare bones, but actually mimics our standard procedure used on the rest of our instruments - a single peak bead’s MFI and CV are tracked over time and plotted on a L-J plot.
Optics
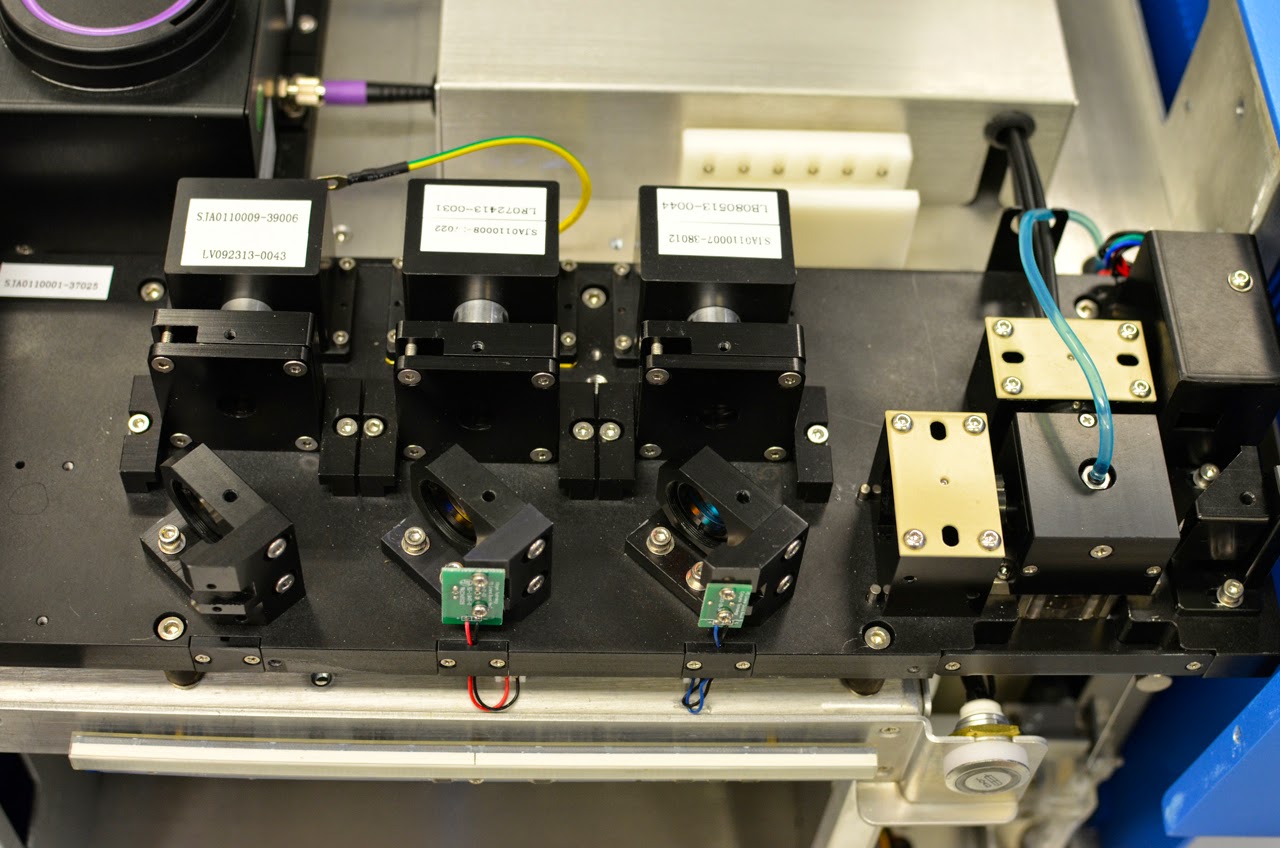
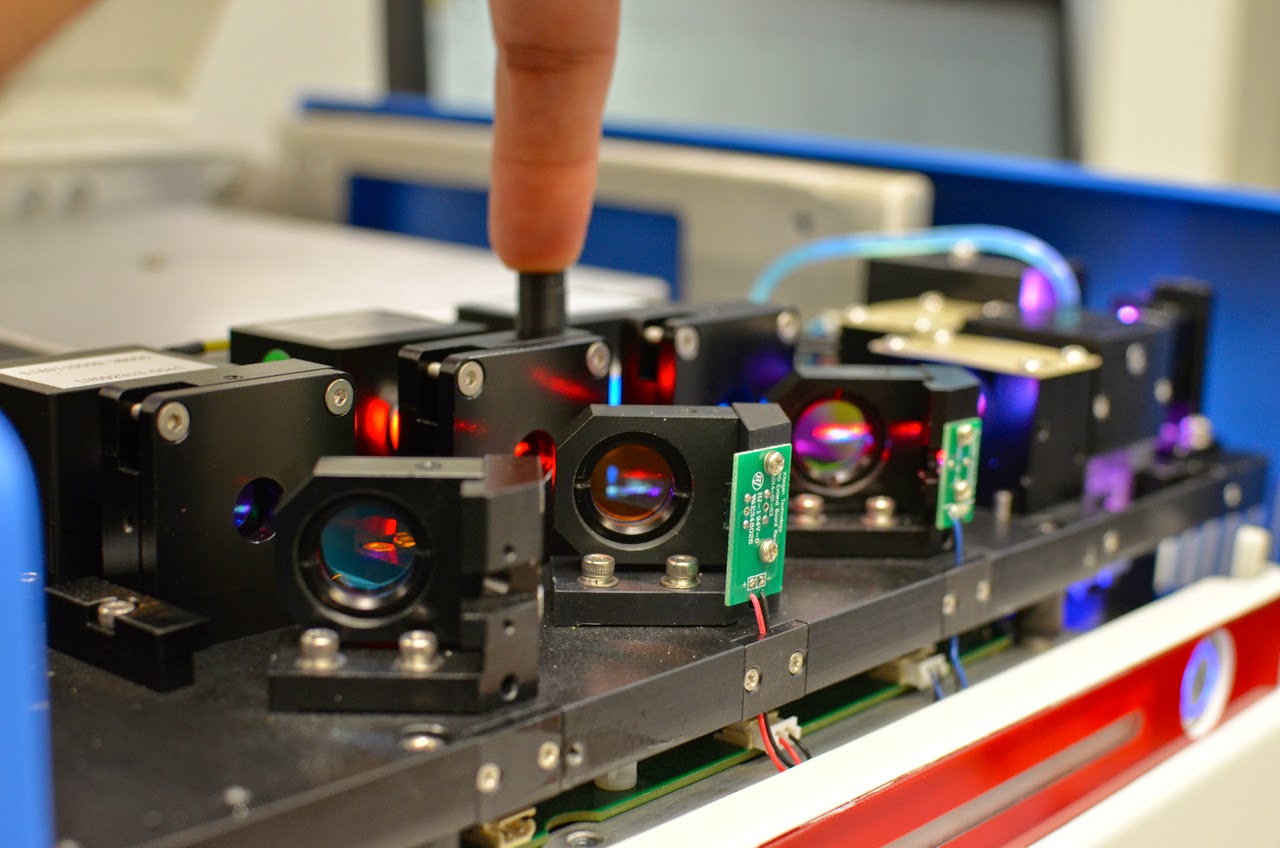
The system has 3 Coherent lasers (405, 488, 640) and 13 fluorescence channels as well as the standard 488 light scatter parameters, FS and SS. However, to save cost and space, only 8 detectors are present. Detectors with a standard filter are re-used across multiple lasers. For example, the far red detector that has a 780LP filter detects QD800 when the event passes through the 405nm laser, PECy7 when passing through the blue laser and APCCy7 when passing through the red laser. In theory, this is no different than having those 3 detectors with the same filter on your instrument in physically separate places. In fact, if you opened up any cytometer chances are you would see the same filter repeated on different detectors. By adding in a delay on the detection side of things, the signals terminating at the same detector can be differentiated with just as much accuracy as three separate detectors. Of course, you can test this empirically by running PECy7 and APCCy7 single colors on the NovoCyte and another instrument that has the same filters but on separate detectors and then compare the spillover values.
When I set up my multicolor panels, I like to stagger the emission across different laser lines. For example, maybe I’ll use BV705, PECy7, and APC together instead of QD800, PECy7, and APCCy7. Doing this on the NovoCyte is a bit more challenging and stacking up 8, 9, or 10-colors in a single panel could pose more spillover issues with this shared detector setup when compared to a 1:1 setup with slightly optimized filters on each detector. It’s for this reason that I don’t think this instrument will actually be a 13-color instrument, but will do just fine with 6 or maybe 8 colors simultaneously. Maxing out the NovoCyte causes an over-population of a few areas of the spectrum, especially the far reds. The table below shows which detectors are shared across lasers. Another point to note is that since the physical detector is shared, that means the "optimized" voltage is shared as well. Whereas normally you might optimize the voltage for BV650 differently than APC, here you're given a single voltage that is "optimized" for both. Let's follow this example a bit further. When I put on unstained cells and adjust voltages, I might expect there to be a higher voltage needed for longer laser/collection filter wavelengths (i.e. more voltage needed for red laser excitation and emission compared to blue or violet). However, with the NovoCyte, I'm given one, predetermined voltage that should work for both. And, to be honest, it does seem to work, although the obsessive compulsive perfectionist inside really wants to fine tune voltages for these two colors independently...but I'll get over it.


Electronics
Similar to the BD Accuri C6, Acea Biosciences chose to go with a fixed voltage system to allow for ease-of-use. It’s well known that pretty much the only thing an end-user can screw up when acquiring data is improperly adjusting the parameter voltages. Having the voltage too high or too low can have dramatic effects on the data. It’s also safe to say that if you looked at the voltages on your cytometer across many people's applications you’d likely find a small range of paramater voltages. So, it’s not surprising that setting a fixed voltage can definitely be beneficial to the masses. Of course there will always be those exceptional cases where you have super bright staining or highly autofluorescent cells, but again that’s the exception, not the norm. As you’d typically find, the spacious 7-log scales, when used with real samples, shrinks down to about 4 decades as the unstained populations typically fall around 10^3. However, the fixed voltage, easy setup philosophy pays dividends when you apply it to a standard workflow. For example, I can walk into the lab, click the startup button, run QC, load a plate, setup my well collection criteria (# of cells, volume, time) and click go. I don’t have to open a bunch of plot and setup voltages or anything like that. I could conceivably collect data blind, dump it into FlowJo and be done. Workflows don’t get much easier than that. Anticipating some complaints in this regard, Acea Biosciences allows for admin-level adjustment of the voltages. This could be handy for those edge case situations where you need a bit more dynamic range, however, as noted above, you still need to be careful since you're actually adjust the voltage for as many as 3 parameters, not just one.
Software
I was a bit perplexed at first when it came to using the software. The sample tube navigation area (akin to DiVa’s browser window) is quite DiVa-like. There’s a top-level container (experiment) with a sub-level group (specimen) that contains samples (tubes). It also allows you to differentiate between group level settings and analysis and tube level settings and analysis. Here, instead of copying and pasting between tubes/groups, you can use a FlowJo-esque drag and drop functionality. The software operates in two modes, and you can switch modes on the fly, that is, you can go from a live acquisition view to a data analysis view. As I’ve mentioned before, I don’t care too much for data analysis features clogging up my acquisition software. One of my key complaints against spending resources developing analysis tools is that anything you build into the acquisition software is not going to be as fully-featured as FlowJo, so why bother. I like to use the example that there are no acquisition software packages that do cell cycle modeling. Well, I can’t use that argument anymore since the NovoCyte software does in fact have cell cycle modeling built-in. I don’t think this changes my view, but if you were in a lab that had one instrument and no prior analysis support, this could be a case where you might acquire and analyze in one place. Outside of that, the software can be as uncluttered as you'd like. Again, since there's no need to adjust voltages, there's really no need to sift through an endless sea of plots and region hierarchies.
Performance
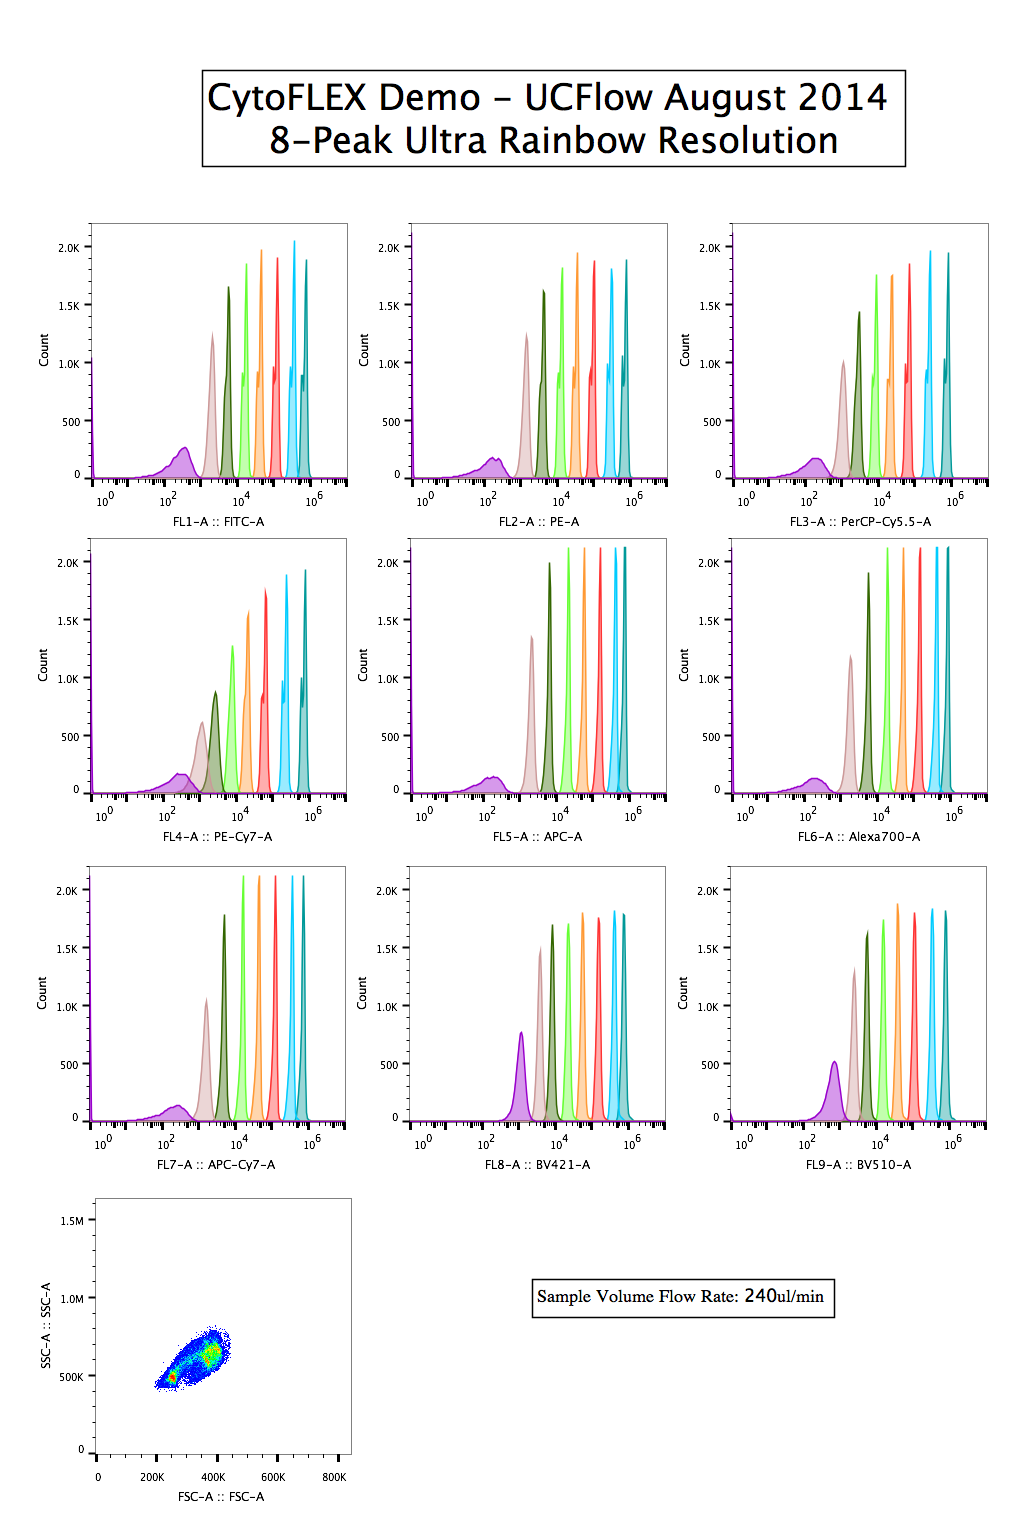
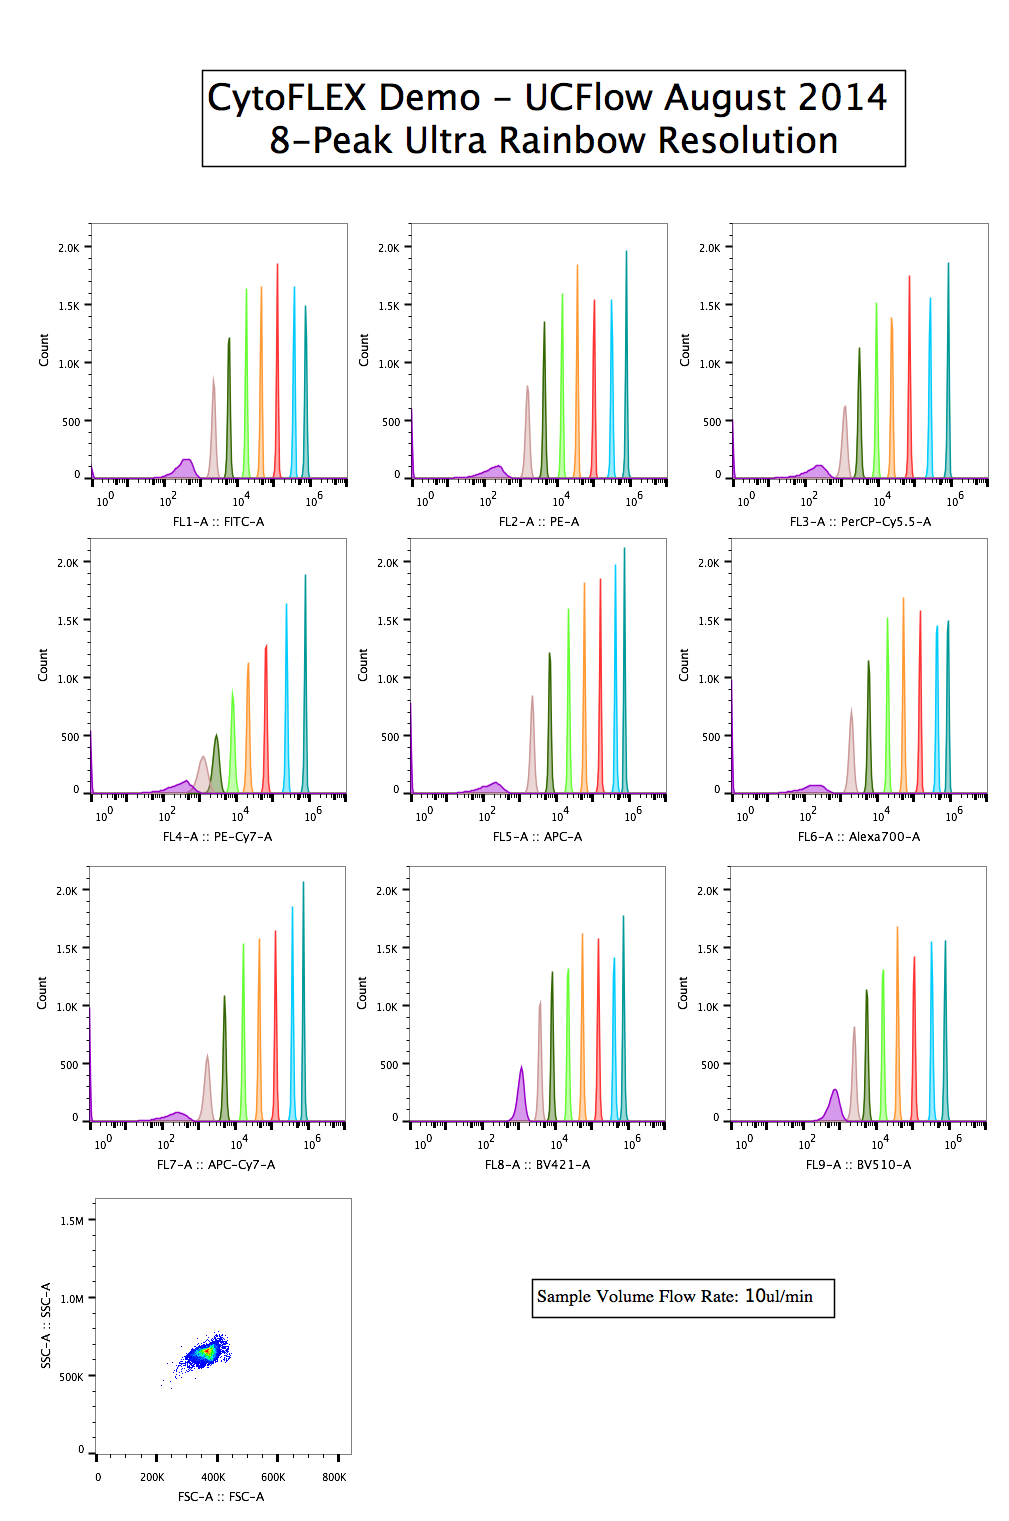
8-peaks

qNORM

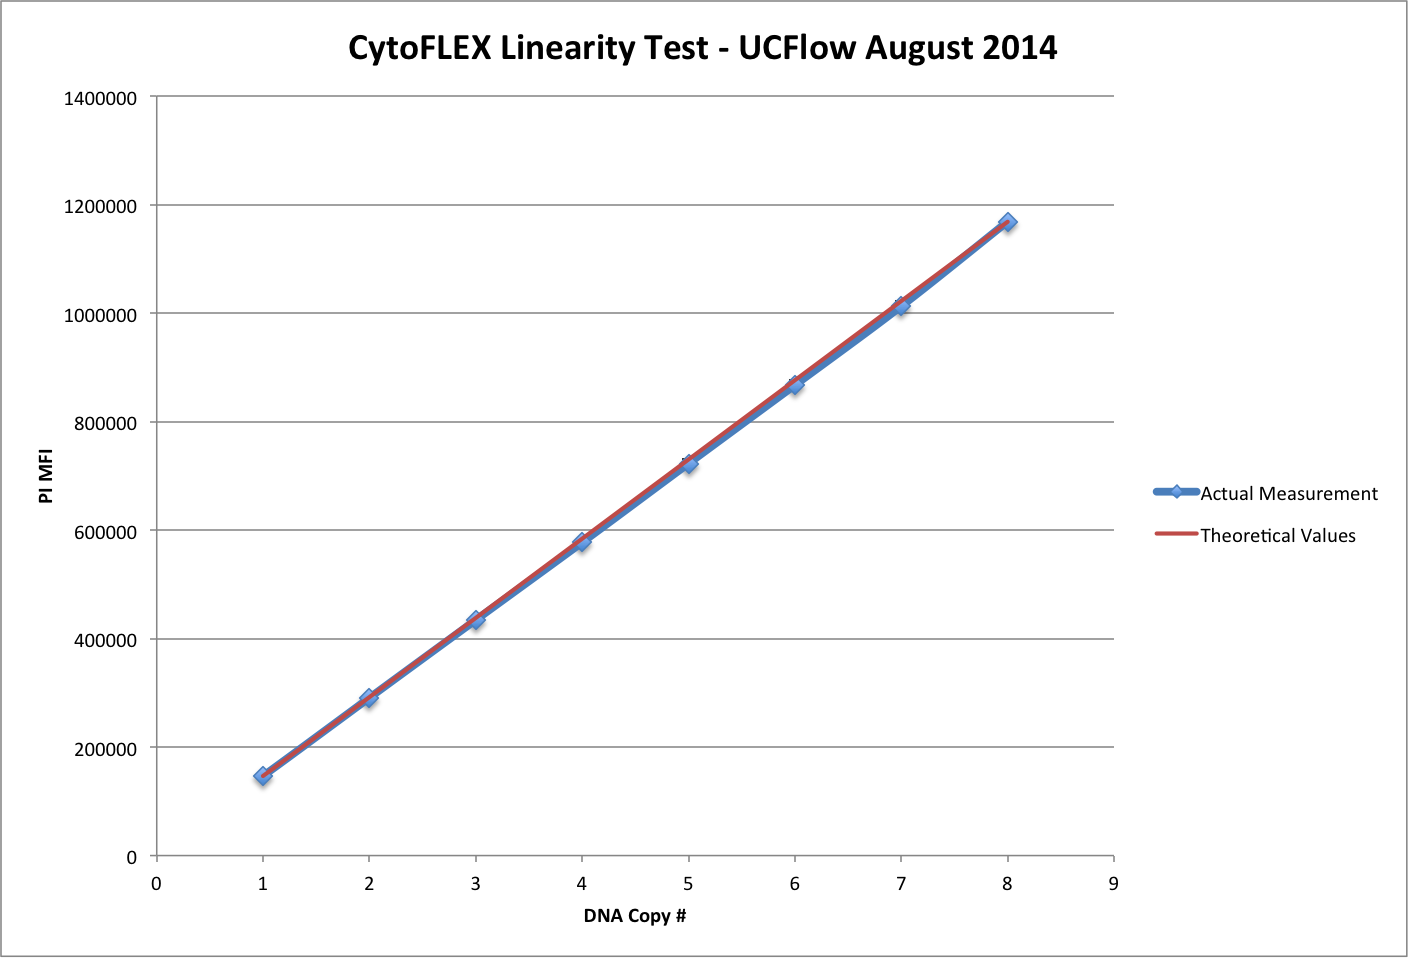
Linearity

Carryover

For the carryover test, I used the default wash options for the NovoCyte sampler. Here I used the same PI stained CENs from the linearity test, but alternated wells with and without PI. In well 1, I ran PI stained CENs (not shown above). In well 2, I ran unstained CENs (first histogram overlay). In well 3, I ran PI stained CENs (second histogram overlay), in well 4 I ran unstained CENs after 1 wash (3rd histogram overlay), and in well 5, I ran unstained CENs after a 2nd wash (4th histogram overlay panel). What you can see, is in the 3rd histogram overlay, immediately after running PI stained CENs, you can see both cellular carryover (the red peak composed of 372 events compared to the background well of 100 events) as well as dye carryover (shown by the increase in MFI of the unstained CEN peak - blue histogram MFI). After the 2nd wash and collection of unstained CENs (4th histogram overlay) the carryover count goes back down to background levels and the MFI of the PI- peak (blue histogram) goes back down to background levels (more or less). So, to achieve less carryover, one would simply do a 2x wash between wells instead of a 1x wash.
Wrap-up
I think the killer feature of the NovoCyte is usability. It performs well enough on all fronts, and although its specs may not be the very best, I think it more than makes up for that with its ease-of-use. Don’t expect it to blow you away by its performance, but then again, it does a fine job. The other variables that come into play when working with a new company is support and service in the field. Will they have enough staff to support instruments located all over the U.S. or possibly worldwide? This is somewhat of an unproven issue. Instrument owners in the field have been pleased for the most part, and one thing that repeatedly comes up is the responsiveness of Acea Biosciences with regards to issues or feature requests. I guess that's one good thing about working with a startup company, they can't afford to lose any customers or get any bad press. Again, aside from its above average usability feature, I think what sets the NovoCyte apart from its competitors will also be price. For the right price, this could very well be the best instrument around...depending on its price.