An updated review of the Attune Cytometer, dated October 2012 is now available: You can reach that post here:
http://ucflow.blogspot.com/2012/10/life-technologies-attune-cytometer-deja.html
EDIT 2: I've met with some folks from Life Technologies and they feel the instrument that was set up in my lab for demo was not properly aligned, and so I've agreed to give it another try. I'm not sure if I'll use the Violet/Blue combo or the Red/Blue system, but either way, I'll post the results and reference back to this post when I have them.
EDIT: Regarding the statement below in the Optics section, "I have not received information that I requested yet, but the 'PMTs' do not appear to be 'PMTs'." I have heard back and there are, in fact, PMTs in the system. It's just not obviously visible when you simply open the hood. They are the Hamamatsu H10720 Series, and in the far red channel, they are using the Red sensitive "-20's"
You've probably heard about the novel approach to sample focusing on the Attune, and you've probably even read through some of the marketing materials distributed by Applied Biosystems (Life Technologies). So I won't go through all those features in detail, but I will share my impressions and tell you what it means for your data in the end.
Briefly, the Attune is a 2-laser, 6-fluorescence detector small-footprint cytometer. The fluidics are syringe pump driven (as opposed to pressure-driven), and it's in the focusing of the cells through the laser interrogation point that is unique. Instead of hydrodynamic focusing applied by a sheath fluid (such as PBS), the Attune uses an acoustic wave form to push the cells into the center of the stream, forcing them to line up in single file. One advantage of this is the small amount of sheath buffer you need to put into the system (roughly 1L per day compared to 6-8L for a hydrodynamically focused system). Another benefit is the ability to push through large quantities of sample fluid per unit time. Whereas a pressurized, hydrodynamically focused system might top out at about 200ul/minute, the Attune can achieve volume flow rates of 1000ul/minute. It can also maintain the CV of the fluorescence signals even at high flow rates. Lastly, the system can actually change how fast the events are passing through the laser interrogation point. They have a standard, and high-sensitivity setting, which tells the system to pass them through at the normal rate, or at a slower rate, respectively. The idea is that if the cells pass through the lasers more slowly, the fluorochromes will emit more photons, allowing you to detect lower amounts of fluorescence.
Optically, the system has a 20mW 488nm laser and a 50mW 405nm laser. There are no other options for laser lines at this point. 3 of the fluorescence detectors are dedicated to the blue laser and 3 to the violet laser, and they're set up for FITC, PE, PerCP/PECy7, and PacBlue, Qdot 525, and Qdot 605/PacOrange. The filters are easily changeable, and there's even a storage section for spare filters (how nice!).
I'll try to break up my comments by instrument components. I will say, many of the complaints I had regarding the software were said to be fixed in an upcoming release, but I will give my opinions based on the instrument I evaluated (03/09/11). Also note that the instrument was installed by a field service engineer and passed their performance and tracking protocol (similar to CS&T a la BD).
Fluidics:
1. Being a syringe pump system, you need to specify how much volume you wish to analyze before you even put on your sample. Of course, you can always add to your sample acquisition, but it doesn't have the 'free-run' capabilities that a pressurized system has.
2. If you tell it to take up 500ul of sample, and then you get enough data, or you want to just take your tube off, the remaining sample in the line goes to waste, and not back to your tube. So you could foresee a possible loss of sample in some situations.
3. The dead volume is huge! 200ul of your sample is taken regardless of how much sample you wish to analyze. So, if you want to analyze 100ul, you need to have at least 300ul of volume in your sample.
4. It was really nice being able to put on different sizes of tubes and not have to worry if they're the right kind or cracked.
5. As advertised, the CV's are really low even going at high sample throughput rates.
6. Although they claim they can run at rates of up to 20,000 events per second, there is no report of the coincident rate going at that speed. A high abort rate would obviously have an impact on detecting and counting rare events. Even on our systems with zero "dead time" we still see coincident events to some degree.
7. Although in theory we'd expect the high sensitivity setting (i.e. slowing the cells down in the interrogation point) to increase resolution, my tests did not show any improvement with stained beads (data not shown). It's likely that the components that contribute to autofluorescence also increase their intensity so the separation between positive and negative doesn't really change.
8. When you tell the system to collect 2mL of sample volume, it does so in (for example) 500ul 'draws' from the tube, i.e. 4 draws from the sample tube. The reason is that they don't want to have all that volume sitting in the tubing waiting to go to the flow cell. The result is that you end up having these pauses in acquisition while the system refills the tubing. Because of this, when you start collecting your sample again, the core stream has not completely stabilized leading to a decrease in fluorescence and a widening of the CV (Data Below). In order to get rid of this data, which will surely mess up your analysis, you'd have to go to each point where it drew more sample and exclude the first few seconds of collection until the stream has stabilized. It's an easy enough fix to make the software ignore data being collected for a few seconds every time it draws, and hopefully they'll implement that fix.
Software:
1. IT'S FREE!!!!!!!!
2. The overall look of the software steals a page from Microsoft Office, with a prominent ribbon at the top for common tasks, and lots of right-click functionality. Users should feel comfortable here.
3. Similar to FACSDiVa software, there is a Experiment Explorer (Browser) that displays your experiment, all the tubes in the experiment, and the settings/plots saved within. There was some confusion in terms of things being applied globally (to the entire experiment) or to an individual tube. Again, similar to DiVa, it's not always obvious if something is applied globally/individually, and how to change that status easily. Lastly, it also resembled the Gallios software in that if you made a change to the plots/regions, you had to click save or else you'd lose those changes when you switched tubes.
4. Gating was somewhat cumbersome. Changing hierarchy of the gating structure after you've created gates was difficult and not intuitive.
5. Displaying large numbers of events was slow and jerky. There was this weird need to press 'F5' to refresh plots with lots of data point.
Optics:
1.
I have not received information that I requested yet, but the 'PMTs' do not appear to be 'PMTs'. There is definitely not a vacuum tube with anode, dynodes and cathode like you'd expect to see. It looks like some sort of silicon diode, but like I said, I haven't heard yet. This could contribute somewhat to the performance I observed.
2. I really appreciate the extra slots for filters on the instrument. I'm a big believer in spare filters, but I can never seem to keep track of them (just look in our MoFlo room).
3. Although the laser powers seem appropriate, there was no mention of how much of that light actually makes it to the flow cell.
Electronics:
1. Testing of linearity across the 6-log scale was good (CEN data below)
2. 23-bit ADC conversion yield 8.4million channels across 6 decades, which generates approximately 76 bins in the 1st decade. This seems pretty good, and would allow for resolution of closely related populations on the low end of the scale, but that's not really what I saw. I was able to see some 'picket fencing' which tells me that the noise of the ADC makes the bit conversion probably closer to 20 bit, which yield about 9 channels of resolution in the first decade. This is speculation on my part since I do not know (yet) what ADC they're using, and what the noise level of that ADC is.
Data: For this I ran my standard battery of tests, the results of which can be found below.
8-peaks: Testing the overall alignment and diagnose background problems due to laser light.
Assessment: 8 peak resolution off the blue laser was not as good as other 'full-size' cytometers (i.e.
FACSCanto-II, or
Gallios)
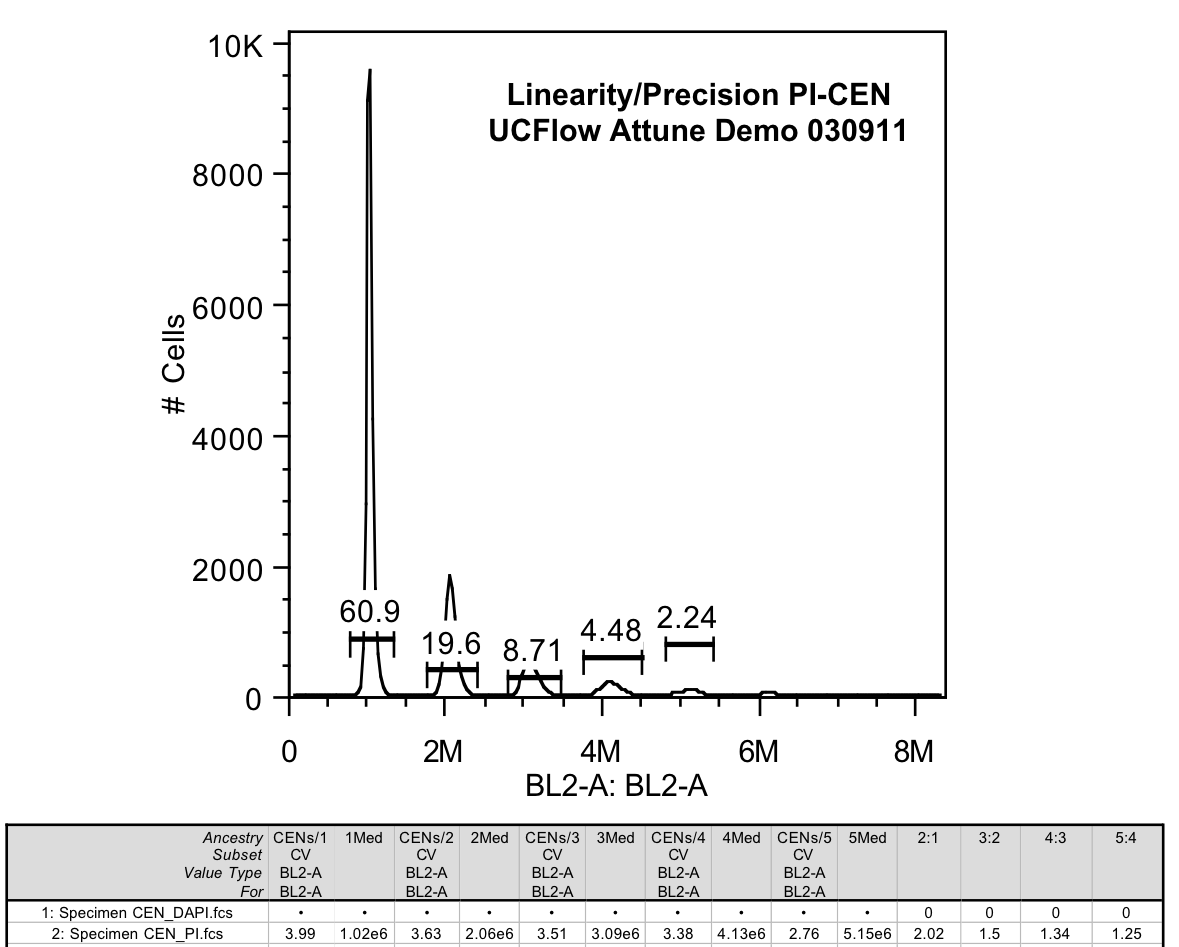
CEN Linearity: Using PI stained (and DAPI stained, but not shown) CENs.
Assessment: Linearity was good along all of the scale tested.
Dim Population Resolution: Here we have Antibody binding beads from Bangs stained with a FITC, PE or PacBlue antibody to demonstrate the ability to resolve increasingly dimmer fluorescence from background. The more separated the peaks, and the further from the blank the better the resolution.
Assessment: The FITC channel (BL1) seemed to be the worst of the 3 tested. The PE channel was ok, and the PacBlue Channel (VL1) was pretty good. To see comparable data on another instrument, check out the same data on the
FACSCanto-II
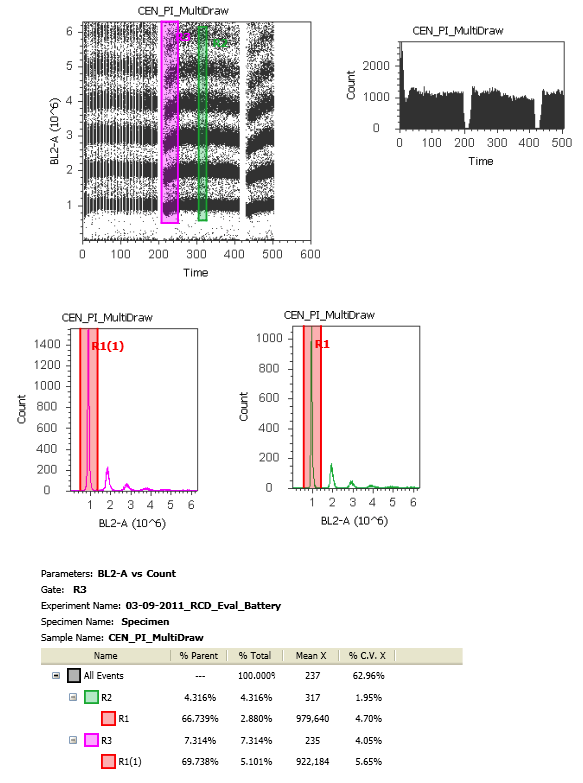
Stream Stability: For this, I tried to have it draw sample multiple times while looking at PI fluorescence in linear.
Assessment: As you can see, the fluorescence dips down every time this fluidics draws more sample. This leads to an overall higher CV if you don't time gate the data. You can easily see this by comparing the purple box at the beginning of acquisition post draw and the green box that's mid-way through that collection.

Final Thoughts: Like many of the smaller sized cytometers, the Attune will probably handle most of the general types of applications, but will not compare to high-end cytometers in its ability to detect dimly stained populations, even using its High Sensitivity mode. The real advantage is its ability to push large amounts of volume of a relatively dilute sample through the instrument without increasing CVs of the populations. For example, a lyse/no-wash rare event blood tube. In most every other case, we would simply concentrate the sample by spinning it down, and run it in a similar amount of time as what can be achieved on the Attune. The overall look and feel of the software is fairly polished. If they're able to correct a few major things (like return unused sample, not store data during stream restabilization, allow for a quicker refresh of data on the screen, and get rid of the F5 necessity) with some software changes, it will be a much better instrument. The lack of a red laser, or laser options is a real hurdle for many people, especially those with a large stock of APC and APCCy7 antibodies, and could be a deal-breaker for many labs. It would also be nice to have a higher powered 488nm option as well. This, along with the whole 'PMT' issue might lead to better resolution in the FITC channel, which was especially poor.