Monday, December 19, 2011

Is Compensation really necessary?

For some reason, it seems like the idea of compensation gets so much 'publicity'.  Everyone is always talking about compensation and how difficult it is.  New users of flow cytometry tend to think of this idea as something so complex that they end up stumbling on this one idea before they even get started.  So, let's get one thing straight right off the bat;  compensation is easy.  In fact, I'd say compensation is ridiculously easy today, now that you really don't have to do anything.  You just identify your single stained controls, and your software package uses that information to compensate your samples for you.  The real difficulty in performing flow cytometry assays is panel design - determining which colors to use and coming up with a panel where you have the optimal fluorochrome coupled to each antibody to give you the best resolution of your populations.  In fact, I'd go so far as to say that in some cases, compensation isn't even necessary.

Wha, Wha, Wha, What???  That's right ladies and gents - compensation isn't even necessary (in some cases).  And, I'm not just referring to the instances where you're using two colors that don't even overlap, I'm talking about straight-up FITC and PE off a 488nm laser.  Now, before you stop reading and jump over to your Facebook feed let me just assure you that you first learned of the superfluous nature of compensation when you were about 5 years old.  You see, analyzing flow cytometry data with or without compensation is nothing more than a simple "spot the difference" game you use to find in the back of the Highlights magazine while waiting to get your annual immunizations from the pediatrician.  If you take a look at the figure below you may be able to recognize the left panel as the FMO (Fluorescence Minus One) control and the right panel as the sample.  Spot the difference?  Instead of seeing the sun missing on the left and then appearing on the right, let's just substitute a CD8-PE positive population for the sun.  It doesn't really matter if the image is compensated, you're just comparing the differences between the two.


Let's make the comparison a bit more directly.  Here we have some flow cytometry data showing CD3 FITC and CD8 PE.  Our goal is to determine what percentage of the cells are CD3+CD8+.  Obviously, there's some overlap in the emission of the FITC fluorescence into the PE channel when run on a standard 488nm laser system with typical filters.  If I were to hand you this data set and pose the question of "What's the % double positive,"  you could employ the same strategy used above in the spot the difference cartoon without knowing a thing about compensation.  The top two plots below are the FMO controls (in this case, stained with CD3 FITC, but not stained with anything in the PE channel), and the bottom plots are the fully stained sample.  In addition, the left column of plots were compensated using the FlowJo Compensation Wizard, and the right column of plots are uncompensated.  Were you able to "spot the difference"?  If you take a look at the results, you'll see that either way we come up with the same answer.  So what's the point of compensating?

As you can imagine, this is greatly simplifying the situation, and when you start adding more and more colors, you simply cannot create an n-dimensional plot that can easily be displayed on a two-dimensional screen.  This could easily work for 2-color experiments - it could even work for 3-color experiments (maybe using a 3-D plot), but beyond that, you're going to have to do one of two things.  1.  Bite the bullet and get on the compensation train, or 2.  Abandon visual, subjective data display altogether and move to completely objective machine-driven data analysis.  Compensation, much like display transformation is a visual aid used to help us make sense of our data, two parameters at a time.  In our example above, we don't magically create more separation between the CD3+ CD8- and CD3+ CD8+ populations.  The separation between them is the same, we're just visualizing that separation on the higher end of the log scale (when uncompensated) where things are compressed in one case, and on the lower end of the log scale (when compensated) where things spread.  You didn't gain a thing.  

Monday, December 12, 2011

10 Steps to a Successful Flow Cytometry Experiment

I've been doing a good amount of application development recently and have had to "practice what I've preached."  Those of us in the flow cytometry world, especially those in core facilities, like to pontificate all the do's and don'ts of flow cytometry, but how many of us have (recently) struggled through all the intricacies of perfecting a staining assay.  I must say, I was a bit cavalier when I first agreed to set some protocols up for an investigator.  The staining protocols weren't anything novel or difficult, it's just that I personally had not done some of the assays in quite a while.  As I was going through the process I thought, hey, this is not as trivial as one might think...and I've been doing this for a loooooong time.  I could only imagine what someone who is brand new to flow cytometry as a technique must feel like when their PI suggests they use this technology to investigate their hypothesis.  So, I can put forth my top 10 steps to a successful flow experiment with some conviction, because I have now walked in your shoes.

I really wanted to make this a top-10, but as hard as I tried, I could only pare things down to 11.  So, without further adieu I present to you;

10 11 Steps to a Successful Flow Cytometry Experiment


1. Read lots of protocols (not just the reagent manufacturer's protocol).  Let's face it.  If you ask a dozen people how to make a peanut butter and jelly sandwich, you'll end up with 12 different recipes.  The same goes for FCM protocols.  Everyone finds a different part of the protocol worthy of emphasis.  If you read a few of them, you can start to put the entire story together.

2. Know which colors work best on your instrument.  This is probably a bigger deal when you're using a core facility with a few different platforms.  Let me tell you firsthand,  no two cytometers are alike in their capabilities, not even two of the same model of cytometer.  If you're lucky enough to have a flow cytometry core with knowledgable staff, make sure to ask them what their favorite 4, or 5, or 6-color panel is.  They should also be able to tell you what the limitations of certain colors on a given instrument may be.

3. When designing your panel, look for max brightness with min spillover.  Ok, let's say you know what sort of antibodies you want to run, and you know what's available, as far as hardware goes, at your institution.  Now comes the fun part. You have a list of antibodies, and a list of fluorochromes - how do you match them up?  You've probably heard the old adage, put your dim fluorochromes on the antibody that targets abundant antigen, and your bright fluorochromes on antibodies against sparse antigen.  In addition to that you want to minimize spillover - fluorescence from probes that are excited by the same laser and whose emission overlaps.  Spillover = Background, and Background = Diminished resolution.  This takes some effort and a bit of know-how, so consult your friendly flow guru for help, or try out some of the new utilities designed to help with this process (namely CytoGenie from Woodside Logic or Fluorish from Treestar).

4. Titrate your reagents.  What for?  The manufacturer told me to use 5ul per test (usually 10^6 cells in 100ul of volume).  Without jumping on the conspiracy theory bandwagon that reagent manufacturers tell you to use too much antibody so that you'll waste your antibody and have to buy more, I will say that I've found more times than not that the manufacturers suggested dilution is too concentrated. If you want to see why you should titrate your antibodies, check out the figure below.  If you want to see how to titrate your antibodies, click on over to this prior entry to the UCFlow Blog.

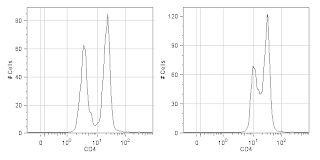
CD4 staining of fixed human PBMCs at the properly 
titrated concentration (Left) and the manufacturer's 
recommended concentration (Right).  


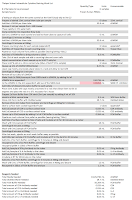
Example Staining Worklist 
5.  Outline your plan of attack.  Make a detailed work list of your protocol.  Generic protocols are good to help plan your experiment, but when it comes time to perform the steps of an assay, you really want a work list.  As the name implies, this is a step-by-step recipe of how to execute the protocol.  I usually include the step, duration, volume of reagent, temperature, etc...  While you're performing your assay, take copious notes so you can fine-tune the protocol, adding more detail.  The goal is to be able to hand this work list and the reagents to another user and they should have successful results.  I like to do this in Excel and write in all the cell formulas so that I can type in how many samples I need to stain and have it automagically do all my dilutions for me.  I also have a summary of the buffers needed and quantities at the bottom.  See below as an example.


6.  Always use a Dead Cell Marker. Dead cells can really screw up an analysis.  I guarantee there is a color and assay compatible dead cell marker available for most every experiment you will do.  There's no excuse not to use a dead cell marker, so please, please do it. It makes for a much nicer looking plot, and you really can't do good (dim) double positive enumeration without it.

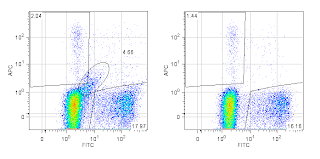
Two-parameter plot without using an upstream dead cell 
marker (Left) and the same plot after removing dead 
cells (Right).  Note the diagonal population extending 
out of the negative population (encircled with a region 
in the left plot)


7.  Set up your FMO's as a separate experiment, not on your real samples.  I won't discuss the merits of using an FMO control (Fluorescence Minus One), let's just assume you know that it's pretty much a necessity.  What I will say is if you try and set up an FMO control on the day that you're using your precious sample, you're likely to either forget it, or omit it because you think you don't have enough cells. So, if possible, set up your FMO controls ahead of time on a different day so you can take your time getting everything set up properly.  It'd be nice to include it every time, if you have enough sample.

8.  Make compensation controls using beads.  I'm a huge advocate of using capture beads to set up compensation.  It's really a no brainer.  I've written about this subject before.  Even if your single stained controls look fine on cells, I'd still use beads because they're always consistent.

9.  Acquire your samples nice and slow to achieve maximum resolution.  If you go through the trouble of perfecting your staining procedure, now's not the time to screw things up.  On a hydrodynamically focused instrument you'll want to concentrate your sample and run it slow in order to keep a narrow core stream and achieve optimal resolution. If you're using another type of flow cell (such as a capillary a la Millipore or an acoustically focused system like the Attune) you should be more focused on increases in background due to insufficient washing rather than a wide sample core.

10.  Analyze your data a couple of different ways.  Even if I have a clear idea of how to go about the analysis, I'm frequently surprised at how many times I've changed axes or started backwards and found I liked the new way better than the old way.  Backgating is one way to help identify a rare population all the way up through its ancestry.  Make sure to take advantage of your Live cell channel as well as gating out aggregates and removing any time slices where there may have been a drift in fluorescence.

11.  QC your instrument and create an application specific QA protocol.  Science is not about 1-shot deals.  If it's not reproducible, it's not real.  In order to give you the best possible chance of getting reproducible data you'll want to minimize the error contributed by the instrument.  Quality control and Quality assurance cannot be emphasized enough.  By doing something as simple as running beads at your application-specific voltage settings you can ensure that the instrument is in the same state as it was the last time you acquired these samples.  For this, I typically use one of the peaks (peak 4, actually) of the 8-peak bead set.  After I have the samples acquired with the proper voltage settings, I run the beads, create target channels for the peaks and save it as a template.  Next time, all I need to do is dial in the voltage to put the beads in the target.  You'll also want to make an Acquisition template and probably an analysis template too.

Well, there you have it.  Hopefully this will help you focus your attention on some key aspects of setting up a well-thought-out flow cytometry staining protocol.  Of course, this merely scratches the surface of all the things you need to think about.  Did I miss something major?  Feel free to leave a comment with your #12, #13, and beyond.

Friday, December 2, 2011

The Year of Acquisitions

Like most industries, the Flow Cytometry Industry appears to be shrinking, in that the number of players on the industry side of things is getting smaller.  For many years, there were a few big players, namely Becton Dickinson and Beckman Coulter (who they themselves were products of mergers - BD+Ortho, and Beckman+Coulter).  They made instruments and reagents and pretty much sold the whole package.  Seeing the potential for others to capture some of the market share, we experienced a growth of smaller start-ups, either focusing on the hardware or the reagents.  Companies like Cytomation (maker of the MoFlo), and Guava on the instrument side of things introduced some nice products and created some much needed buzz.  A major impact of these companies was that it forced the major companies to invest in R&D and come out with more competitive products.  On the antibody side of things, reagent-focused companies like eBioscience and Biolegend gained popularity.  But, I think a real turning point happened when little-known Accuri Cytometers exploded on the scene with a low-cost, small footprint cytometer with capabilities similar to a FACSCalibur.  They took a page from the Guava playbook and targeted individual labs instead of the typical cytometer purchaser - a core facility.  Soon other companies were seeing the success of these platforms, and the much larger market outside of the core facility.  Companies like Stratedigm, Life Technologies and iCyt started offering smaller sized, less expensive cytometers.  It seemed like the cytometery industry - both on the instrument and reagent side - was expanding.  This lead to competition and innovation.  The old standby's like BD and Beckman Coulter were forced to come up with new and exciting products to maintain their market share.  And then the recession hit.

So, what happens in a recession.  Well, contrary to what you might think, many companies do just fine in a recession.  Of course their growth may slow, but then they also tend to accumulate capital as well.  In fact many companies wind up in a situation where they have lots of cash on hand and are sort of waiting to see what's going to happen.  John Waggoner explains in a USA Today piece (http://www.usatoday.com/money/perfi/columnist/waggon/2011-05-05-cash-in-on-mergers-and-aquisitions_n.htm)  that this past summer, it was estimated that companies in the S&P 500 stock index had a combined $940 Billion in cash.  I postulate that the well-established cytometry companies were/are in a similar boat...but to a much lower degree.

Mr. Waggoner goes on to explain, companies with cash-on-hand basically have three things they're going to do with it.

1.  They can reinvest in the company, hire more people, build more plants, funnel it into R&D, etc...  However, with funding becoming more and more scarce, there's not enough demand in the market to warrant such reinvestment.

2.  They can return money to their investors in the form of dividends.  Some companies are doing this, but probably in moderation.

3.  They can buy another company to position themselves for the recovery.  Mergers and Acquisitions are a pretty huge business in recent years.  In total, M&As are running at a $1.6 Trillion pace for 2011.  A good chunk of this is happening in the healthcare sector.  

Bingo.  Herein lies the recent increase in mergers and acquisitions.  For example, Accuri raises ~$30 Million to get their business going, BD sees the threat and buys them for $205 Million (not a bad ROI for the Accuri Investors).  BD removes the threat, and clears the way for its new flagship, small footprint, easy-to-use cytometer, the FACSVerse.  This works for reagent companies too.  Affymetrix buys eBioscience, EMD-Millipore buys Guava and now Amnis, Life Technologies licenses the acoustic focusing technology to build the Attune, and on and on it goes.  Even bigger name companies like Sony and Danaher are getting into the game.  Sony purchased iCyt to see if it can get its foot into the biomedical research arena, and Danaher purchased Beckman Coulter for who knows what reason.  At any rate, it seems like the industry is attempting to go back to the old days where you'd do all your shopping at one company.  Buy your instrument, reagents, analysis software, and all the rest from one company.  You'll end up having BD labs, Millipore Labs, Life Technology Labs and maybe even Beckman Coulter Labs.  A necessity in the current environment, but I'm sure things will oscillate back to the innovative start-ups taking on the big-boys once again.  So, who's next to be gobbled up?  I'm sure companies like Stratedigm, Blue Ocean, and Cyntellect are hoping their phones will start ringing.