TVs, PSPs, PMPs, Laptops, and now Flow Cytometers? This seems like something out of left field, but Sony recently acquired University of Illinois start-up company iCyt. For those of you not familiar with iCyt, they are developers of the 4-headed sorting monster, the Reflection, and more recently, the Synergy (a sorter/analyzer hybrid), and now the Eclipse (a bench-top analyzer capable of doing particle sizing, absolute counts, multi-well sampling, and multi-color analysis). iCyt has certainly made a name for itself by bringing new and exciting technology to a field overpopulated with BD instruments and clones of BD instruments, and it looks like companies like Sony have taken notice. There was no way iCyt was selling enough instruments, and generating enough capital to do the development it wanted, so this acquisition is probably the best thing that could have happened to them. Gary Durack, founded and President of iCyt (and the former Director of the flow core at U of I) had this to say about the new acquisition, "As a Sony company, iCyt will be able to leverage Sony’s global resources to deliver a variety of innovative solutions to the cell analysis market. This is truly a win for iCyt, its customers, and all who will benefit from these advances." Sony desperately wants to enter the technology side of biomedical research where they feel they can make an immediate impact due to their $79 billion in annual revenue. Keiji Kimura, EVP of Sony had this to say: "iCyt’s experience and technologies will be valuable assets for Sony as it expands into this new business domain. We are confident that this acquisition will accelerate the development of Sony’s flow cytometry business by combining Sony’s expertise in the manufacturing of consumer products with the technological assets of iCyt."
I cannot wait to see the 1st flow cytometer controlled by the PSP motion controller. I mean, it had to happen sooner or later. Kids today (allow me to put on my "old man" hat for a minute) expect everything to work like a video game/social network. So why can't flow cytometers, and for that matter, all biomedical research technologies, operate like every other modern technology. Isn't scientific collaboration just a guise for social networking? Where is the Facebook of science? Why can I not run a flow cytometer with 5 of my "friends" (colleagues-represented by their avatar on screen) assisting me in picking out the important pieces of data? I know some of these things exist in some ways, but if it's not integrating seamlessly into the technology, no one will use it. This is where a company like Sony can come in and make lots of waves. They already know how to do all this stuff; think PSP marketplace, but for flow reagents, or analysis scripts, or cool software hacks. 3rd party, open-source geeks (me included) will jump all over this stuff.
One other area of importance is the whole idea of low-cost CD4 counts for areas of the developing world afflicted by HIV/AIDS. I know this is something that Gary Durack is already pursuing (see Cytometry for Life), perhaps now with a global company with lots of money and lots of influence around the world, a new integrated system that can truly allow for low-cost CD4 counts can be developed. I can't wait to see what comes out of this new marriage.
Tuesday, April 20, 2010
Friday, April 16, 2010
ISX Fluorescence Intensity versus FCM

One of the first questions people ask me about the ISX is how does the fluorescence intensity compare to a standard flow cytometer (FCM). In a quick attempt to partially answer that question, I ran some BD Calibrite beads on our LSRII-Orange and our ISX, and have posted the results in the attached slide. I ran PerCP beads in hopes of demonstrating that the high laser power and long illumination times on the ISX would photobleach the signal (which it did). I also ran FITC, PE, and APC beads as sort of a general comparison of commonly used fluors. The results are fairly nice. FITC is nearly identical on the 2 instruments, PE was brighter on the FCM (probably due to filter ranges), and APC was really bright on the ISX (due to the zero background fluorescence in this channel). The other thing to test was how well the IDEAS software compensated the spillover. For FITC and PE, it was fine. However, because the PerCP was so dim in the PerCP channel, (APC was actually brighter in the PerCP channel than PerCP was) compensating those two took quite a bit of trial and error on my part. I manually adjusted the comp values until it looked acceptable. The resulting plot pretty much explains it all. You'd be hard pressed to easily identify APC, PerCP double positives in this example (luckily there were none, so no problem). Anyway, just wanted to give you a quick peak into how things may match up when trying to set up your color choices for the ISX.
Wednesday, April 14, 2010
Biolegend's Kelly Lundsten in tha house
We are hosting a seminar on multicolor cytometry next Thursday and we think it should be an absolute blast. We got fluorescent chemistry specialist Kelly Lundsten from Biolegend to come over and talk about the different factors involved in choosing the right panel of fluorochromes in a flow cytometry experiment. For example, she’ll cover the level of antigen expression, with signal:background of the fluor and detection channel, how to categorize antigens to minimize the need for multiple fluorophore versions of the same antibodies, etc. There will be an example of a 10 color assay optimization and the use of FMO controls for gate placement. She will also cover the ins and outs of the different dye chemistries too, organic dyes, proteins and nanocrystals from both a theoretical and practical perspective. Seriously, ask her about nanocrystals. Then try to interrupt her. Fun.
The seminar will be held on:
Thursday April 22nd 2h30PM to 4PM
KCBD Auditorium (room 1103)
Refreshment and snacks will be served.
This should be a very cool talk. Hope to see you there. Let me know if you have any questions.
The seminar will be held on:
Thursday April 22nd 2h30PM to 4PM
KCBD Auditorium (room 1103)
Refreshment and snacks will be served.
This should be a very cool talk. Hope to see you there. Let me know if you have any questions.
Monday, April 12, 2010
Easy FTP data Transfer
You will now see an icon on the desktop of each "windows-running" computer that says "Upload data to FTP Server." You can begin using this to transfer your data files from the acquisition computer to the Data Server. You can then log into the FTP server from your desktop computer and download the data files to your PC. Please note that the Data Server is NOT a data storage server, it is simply a means for transferring your data to your computer without having to use removable media (USB drives, CDs, etc...). You can upload your data to the server from the Macs as well, but you will not be using the Fling application. We will just map the directory on the FTP server to an alias on the desktop. Detailed instructions will be mailed to the list, if you do not receive these emails, send us an email directly or call the lab.
Now that's more like it. ISX Data Samples
We've had the opportunity to run a few real experiments on the ISX over the past week or so, and the data we're collecting seem quite interesting. We've performed the following experiments: NFkB translocation, GFP Foci Counting resulting from DNA Damage, Ploidy Analysis using CEN Reference Cells, and Cell Cycle. I've attached a few images of some compiled .ppt slides. They should be pretty self explanatory, but here's a quick run-down.
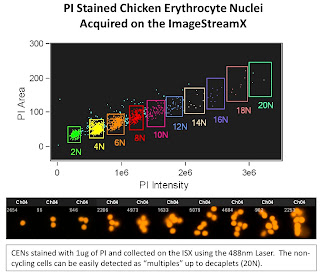
The 1st slide is looking at Chicken Erythrocyte Nuclei which is typically used as a reference peak when doing DNA ploidy analysis. These nuclei tend to pack closely together yielding discrete peaks at 2N (1 nuclei), 4N (2 nuclei), 6N (3 nuclei) and so on. The one interesting thing to note here is the ability of the ISX to display up to 20N (decaplets) on a linear scale. This gives you an idea of the dynamic range possible with this system. On a traditional Flow Cytometer, you'd only be able to display up to 8N on a linear scale due to the narrow dynamic range.
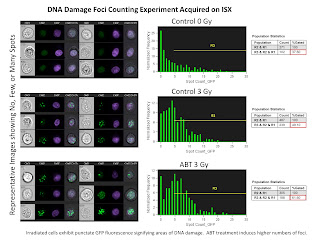
The second slide is a Nuclear Foci Counting experiment. For this we used the EDF filter (Extended Depth of Field) in order to get all foci in 3 dimensions in focus at the same time. The remarkable thing here is the ability for the IDEAS software to locate and count the number of foci inside the nucleus anywhere from 1 foci up to 25 foci.
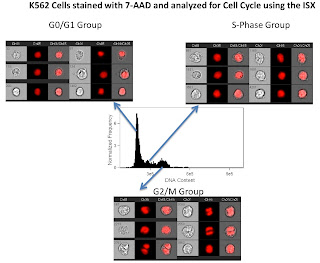
The third slide is a simple cell cycle analysis. As you can see this looks much better than my 1st attempt. What's really neat, is that using a few more morphology parameters such as the "centroid" feature, we could easily separate out the late mitotic cells (easily discernible from the images in the figure) from the G2 cells. Of course we could always add in a marker or two to label the phospho-Histones to make that process easier, but you get the idea.
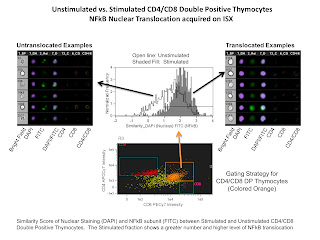
The last slide is of an NFkB tranlocation experiment. The analysis involved here compared the nuclear staining DAPI with the NFkB translocating subunit stained with FITC. If the staining is similar (i.e. translocated NFkB) a higher similarity score would be given, and if the staining is anti-similar (non-translocated NFkB) a low or negative score would be given. In this example we are simply comparing stimulated versus non-stimulated samples demonstrating a higher level of nuclear translocation of NFkB in the stimulated sample.
So, as you can see, very interesting data is being collected. If you have any questions, or want to try something, give us a call. Remember there is NO USAGE FEE on this instrument for a limited time!
Subscribe to:
Posts (Atom)