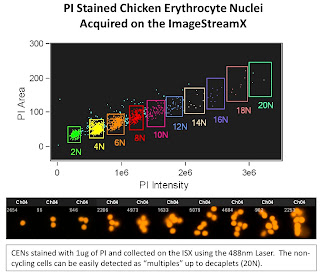
The 1st slide is looking at Chicken Erythrocyte Nuclei which is typically used as a reference peak when doing DNA ploidy analysis. These nuclei tend to pack closely together yielding discrete peaks at 2N (1 nuclei), 4N (2 nuclei), 6N (3 nuclei) and so on. The one interesting thing to note here is the ability of the ISX to display up to 20N (decaplets) on a linear scale. This gives you an idea of the dynamic range possible with this system. On a traditional Flow Cytometer, you'd only be able to display up to 8N on a linear scale due to the narrow dynamic range.

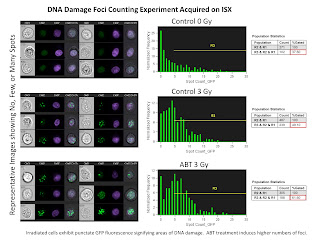
The second slide is a Nuclear Foci Counting experiment. For this we used the EDF filter (Extended Depth of Field) in order to get all foci in 3 dimensions in focus at the same time. The remarkable thing here is the ability for the IDEAS software to locate and count the number of foci inside the nucleus anywhere from 1 foci up to 25 foci.

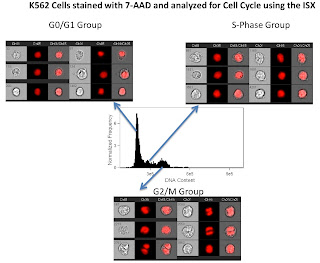
The third slide is a simple cell cycle analysis. As you can see this looks much better than my 1st attempt. What's really neat, is that using a few more morphology parameters such as the "centroid" feature, we could easily separate out the late mitotic cells (easily discernible from the images in the figure) from the G2 cells. Of course we could always add in a marker or two to label the phospho-Histones to make that process easier, but you get the idea.

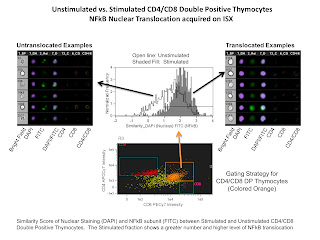
The last slide is of an NFkB tranlocation experiment. The analysis involved here compared the nuclear staining DAPI with the NFkB translocating subunit stained with FITC. If the staining is similar (i.e. translocated NFkB) a higher similarity score would be given, and if the staining is anti-similar (non-translocated NFkB) a low or negative score would be given. In this example we are simply comparing stimulated versus non-stimulated samples demonstrating a higher level of nuclear translocation of NFkB in the stimulated sample.

So, as you can see, very interesting data is being collected. If you have any questions, or want to try something, give us a call. Remember there is NO USAGE FEE on this instrument for a limited time!
No comments:
Post a Comment