Wednesday, October 5, 2011

GLIIFCA 20 Wrap-up.

If you're unfamiliar with the Great Lakes International Imaging and Flow Cytometry Association (GLIIFCA) meeting, you can check out this year's program online here.  It's sort of a morph between a technology focused user group meeting and a smaller scale scientific meeting.  The focus really is on the utilization of our technology (which I'll refer to under the umbrella term Cytometry) in clinical, translational, and basic research.  There is also a strong cytometry vendor presence; about 30 different companies bringing their latest and greatest products.  If you'd like to see who attends and supports the association, you can see a list of sponsors on the GLIIFCA site.  A part of the meeting that's always a bit disconcerting for me is the Friday night Industrial Science Symposium, which is code-language for "vendor sales pitches."  It's been pretty poor some years and not-so-bad others.  It really depends on the presentation and the quality of information put forth.  You can tell some people are up there literally just trying to sell a product.  A good presenter will educate the audience so that the individuals sitting in the chairs come to the conclusion on their own that this is the product they need.  And I have to say, we witnessed one of the best examples of this last Friday night in a presentation given by a Chicago-favorite, Kelly Lundsten from BioLegend.  Great talk, and actually a pretty good session in total.

A Slide grabbed from Janet Siebert's
(Cytoanalytics) Presentation at GLIIFCA 20
The "theme" of the meeting was Cytoinformatics (as opposed to Bioinformatics).  As far as the scientific program, it was the first time I found myself thinking, maybe these informatics people aren't wacked.  I hear what they're saying, but it usually doesn't strike a chord with me.  The basic idea is that you're generating tons of data of various kinds that needs to be quickly integrated in a consistent format in order to support analysis and subsequent decision-making.  And I think my resistance has always been in the format of, "Well I don't really generate THAT much data, so I don't have to worry about this stuff."  After sitting through a few examples of data generation from some groups that I know pretty well, it got me thinking.  The quantity of data can be pretty big even if you're only doing 8-12 parameter flow cytometry or less.  This isn't something only for the 18-parameter groups, it's for everyone.  Besides the flow data, it would be nice to integrate this info with subject info, imaging info, genomics info, etc..  I think what was pretty successful for this meeting is the fact that it was setup in such a way that you could see the progression of ideas surrounding management of data.  1.  Here's the problem: People collect lots of heterogeneous data types.  2.  Here's the types of tools needed:  Data warehousing, including dimensional models, ETL (extract, transform and load data), and end-user tools to read the relational database.  3.  Here are some examples of how people are using these tools with real data and how it impacts decision-making.  That was basically GLIIFCA 20, Symposium 1, 2, 3.  Kudos to the program committee.

UCFlow's GLIIFCA 20 Poster
There were also a pretty good crop of posters presented this year, including mine (which won a poster award, thank you very much).  Two of them which stuck with me were the "Increased number of laser lines on your cytometer might mess stuff up, so be careful" poster and "Look at this awesome temperature control/antagonist injection apparatus I soldered together with some parts from Home Depot" poster.  I'm paraphrasing the titles, of course, and you can find the full poster abstract in the GLIIFCA 20 program linked above.  The first one is from the folks just up the road at Northwestern (Geoff Kraker and James Marvin), and the second one comes to us from Roswell Park courtesy of Ed Podniesinski and Paul Wallace.  The UCFlow poster was about how "I can't stand looking at QC data, so I'll start using cool Google tools and graphics to make it more interesting and maybe I'll stick with it longer."

So, there you have it.  Another year, another GLIIFCA.  For the record, this was my 11th GLIIFCA attendance.  I have officially attended a majority of GLIIFCA meetings.

Thursday, September 22, 2011

Safety; It's not to be taken lightly

I'll begin by saying, I definitely need to pay closer attention to the various safety concerns in a lab.  All too often we sacrifice our own safety in order to get things done quicker; cutting corners, thinking I'll be careful.  And then, bam, you have an incident that you regret.  Fortunately, I haven't had to deal with this first hand, but what I'm going to describe here happened close enough to home that it caused me to pause for a minute and evaluate my own techniques and protocols in the lab.

Perhaps some of you are aware of a recent incident at the University of Chicago, where a scientist became infected with the same strain of bacteria that is being studied in the lab (B. cereus).  According to information published on the Science Magazine site, the infected individual was not even working with the microbe but may have transfered it to an uncovered wound via a spill (http://news.sciencemag.org/scienceinsider/2011/09/university-of-chicago-microbiologist.html).  I believe the infected person is going to be fine and needed to undergo surgery to remove the infected tissue, so that's positive.  As a result of this (and another incident just 2 years ago), the PI is moving these sets of experiments to Argonne National Labs in the Howard T. Ricketts lab, where they are also running experiments on Plague, MRSA, and Anthrax.

It was roughly two years ago to the day that a researcher in this same Laboratory at the University of Chicago died from exposure to an attenuated form of Y. pestis.  In this case, the researcher may have felt a bit safer than he was, since the strain was determined to be non-lethal.  His co-workers admitted that his glove wearing practices were inconsistent at best.  It just so happened that he also had an undetected/untreated condition known as hemochromatosis, or an overload of iron in the blood.  It may have been this overload of iron that allowed the attenuated version of the bacteria to become virulent (http://en.wikipedia.org/wiki/Malcolm_Casadaban).  


So, as you can see, we have plenty of examples of the potential threat to our safety and those around us, and we should use examples like these, not to place blame on those who made mistakes, but to remind us of the importance to slow down and think about what we're doing and what we need to do to stay safe.  There's really just two reasons why incidents like this happen; Carelessness or Ignorance.  You have to be aware of what you're working with.  Ask questions if you're unsure.  Educate yourself.  Nothing is so important that you cannot take the extra steps to make sure you and those around you are protected as much as possible.  


Those who work in your safety office are not out to get you.  They're here to educate first and foremost, and yes, to enforce standard operating procedures for your protection.  In perusing our own safety department's web site, I stumbled upon this - Shared Responsibility.


Mission:  http://safety.uchicago.edu/about/index.shtml


Environmental Health and Safety provides services and support for efficient, effective, and compliant work practices, while promoting a culture of shared responsibility by students, faculty, staff and visitors for a healthy, safe, and environmentally sound educational and research community at the University of Chicago. 


And specifically regarding Laboratory Safety, they have this to add: http://safety.uchicago.edu/labpersonnel/index.shtml
Research is one of the two main missions of the University, the other being education. Lab personnel are integral in the creation and maintenance of a safe laboratory environment. They are responsible for ensuring safety in laboratories and lab support areas on campus and within the Medical Center. This responsibility includes:
  • Being familiar with University emergency procedures;
  • Responding appropriately in the event of an emergency;
  • Being familiar with Environmental Health and Safety policies and procedures;
  • Maintaining a safe laboratory environment;
  • Knowing the hazards of the materials and/or equipment being used;
  • Following all safety procedures in the laboratory environment;
  • Selecting, using and understanding the limitations of personal protective equipment;
  • Reporting any unsafe conditions to your supervisor and/or Environmental Health and Safety; and
  • Reporting any job related injuries or illnesses to your supervisor or Human Resources Administrator immediately; and
  • Participating in all required safety training.

So, hopefully if you've taken the time to read through this, you can certainly take the time to re-evaluate the procedures in your lab.  Make a plan to educated your staff and those around you, and open the lines of communication between your lab and those who have been tasked with the safety of your institution.  Stay safe!

Wednesday, August 10, 2011

Where's my Dream Cytometer?

Have the market research groups recently been clamoring at your door?  It seems like a weekly request via email or phone call to take "10 minutes" to answer some questions about "the future directions of flow cytometers and associated reagents."  I've answered these calls so many times in the past few months that I'm starting to sound like a broken record.  My hope is to perhaps just send them this link instead of spending time scoring questions on a scale of 1 - 10 with my stock answer of, "uh, maybe about a 7."  So, what I'm attempting to do here is write down some loose specifications of the sort of instrument I'd like to see in the not-so-distant future, and perhaps comment a bit about reagents as we go along.

Lasers:  I think the real key here, in terms of the number and wavelength of lasers, is options.  If I had an unlimited budget, I think I'd probably put about 8 lasers on my cytometer (UV, Violet, Blue, Green, Yellow, Orange, Red, Far Red) pretty much covering the spectrum.  I'd never dream of running all 8 lasers simultaneously, so they'd all need to have the ability to be shuttered on and off.  I'm not a huge fan of turning lasers on and off constantly throughout the day, so I'd prefer to have them behind an electronic shutter.  It's difficult to imagine purchasing an instrument with fewer than 4 lasers, but perhaps costs may force me to.  I'd probably want to run as many as 5 lasers simultaneously, so we're aiming for 5 interrogation points.  I'd also really like to have the ability to send lasers to different interrogation points.  Most of the time, you'd probably not run UV excitable and Violet excitable dyes at the same time, so they could probably share a pinhole.  But, in the instance where you would like to run them simultaneously, you'd probably want to split them to different pinholes and maybe even separate them by a pinhole or two.  This would require some re-engineering of the way lasers are delivered to the flow cell, but I have a couple of ideas of how this might work, so it looks plausible.  In terms of actual laser wavelength, that's to be determined.  I'd need to weigh the merits of a 550nm laser versus a 561nm laser, etc...  Regarding power, all I'd add is that I don't want to buy a 100mW laser to get 50mW at the point of interrogation.

Optics:  Spectral overlap among fluorochromes excited off the same laser is to be avoided.  So, it really doesn't make any sense to have more than 3 detectors off any one laser line. As you put more and more detectors on a single path, you have no choice but to break the light up into smaller and smaller bits, so by default you'll be compromising on photon collection; squeeze down the PE filter so you can run it, PETexasRed, and FITC all off the 488nm laser - this is absurd.  You'd also want to stagger the emission filters so you're not looking at the same light from different paths that happen to excite off multiple lasers (think PerCP off the blue and PECy5.5 off the Green - change this to PECy5 off the green and PerCPCy5.5 off the blue).  However, it DOES make sense to be able to detect lots of different fluorochromes off any single laser line.  How can this be accomplished?  Through quick change filters.  For example, let's say we have 3 detectors off the Blue laser (SSC, FITC, PerCP, for example).  I'd like to use that FITC detector for FITC, CFSE, GFP, mVenus, Aldefluor, Sytox Green, etc...  Most people will have a 530/30 filter on their 'FITC' channel, but this may not be optimal for all the different 'green' fluors you may use.  So, one option would be to use a wider band pass on that channel, say a 525/50.  This is fine until I need to turn on my Green laser for excitation of some fluorescent proteins like mBanana.  In this case I'd want to change my GFP filter to something like a 510/20, but then change it back when I'm not doing fluorescent protein work.  Ideally, I'd like to tell the software which color combinations I'm using and have it adjust all the filters necessary to optimize fluorescence collection and minimize spectral overlap, but in the meantime, I want a system that has the ability to easily change filters, know which filter in in which detector, and have a place to store filters not currently being used so they don't get all scratched up and full of dust.

Electronics:  I use to scoff at those who said they needed 5 and 6+ logs on their cytometer, but I'm coming around a little bit. I could easily see my next cytometer having at least 5 logs of dynamic range, but only if it has the right electronic components to fill those 5-6 decades.  See this post for some ideas regarding that - Putting an End to the Log Wars.  There's really no reason why our instruments should not have really fast processors that can do fine detail pulse processing.  We're 11 years into the 21st century, yet we're using stuff developed in the 1980's. A great optical system is nothing without an equally great Electronics system.

Fluidics:  In my eyes, Hydrodynamic focusing is still king (See edit below for clarification on how acoustic focusing is implemented specifically on the Attune Acoustic focusing focuses the cells, but not the sample fluid so you end up picking up fluorescence from unbound fluors in the illumination volume - this is the same issue with capillary systems), whether it's in a small chip or in a flow cell, however the sheath velocity going through the sensing area could be sped up to allow for higher event rates without increasing the size of the sample core stream.  This, of course would require better electronics with much higher resolution to sample the short pulses and really good collection optics to collect as high a percent of emitted photons as possible, not just the small fraction that just happen to emit at 90 degrees to the incident light.  I'd also caution against the desire to make super complicated fluidics systems that tend to break constantly (I'm looking at you FACSAria I and FACSCanto-A).

Software:  Flow Cytometers are built by engineers, and it's usually the case that they find the engineer who knows most about writing software and say, "Let's get some software written to run this thing."  There's usually not much usability testing, UI design thought, etc...  The last batch of cytometers I've looked at have had a bit more polish on their software, so things look like they're headed in the right direction.  The trend to borrow from MS Office and use ribbons all over the place is probably a safe bet. You'd have to assume Microsoft has done a bunch of usability testing, and if it's good enough for them, it's probably good enough for us.  However, we're not word processing or making tables or even making presentations, we're adjusting hardware components using software tools, collecting data, and displaying that data on screen.  So, in reality, we should be using a model that the everyday Jane Q. Researcher would be familiar with that performs a similar task.  I'll throw out a couple of examples.  I love the OSD (On Screen Display) on my Samsung LCD television.  It allows me to easily get in, adjust settings like Color mode, Brightness, and Sound and get out all while not completely obstructing my view of the picture behind.  Just change out Color mode, Brightness and Sound with Parameters, Voltage, and Compensation and switch picture with plots, and there you go.  If you're a Photog, you probably use software like Aperture or Lightroom.  These software tools allow for some pretty specific settings and adjustments but in a clean, easy-to-use interface. So, let's use these types of software to model our cytometer software after instead of a word processing software.

Reagents:  I want lots of antibody choices, which is only going to be possible from a company that has ties to Research Institutions that make new antibodies and are willing to license them to companies for profit (eh-hem, our Monoclonal Antibody Facility has done and continues to do this on a regular basis).  I also want them coupled to a wide range of fluors, especially the new ones like the brilliant violet.  I want to be able to try before I commit, whether this be via a free sample, or a really inexpensive small aliquot.  I'm not at all concerned about having reagents tied to my equipment, and I actually dislike that trend.  I'm not going to buy a cytometer because some company made a canned "apoptosis kit" that works specifically for their instrument only to find out it's using Annexin V FITC and PI.  The 5 questions I ask when finding an antibody.  Do they have the antibody?  Is it coupled to a range of fluors that work for my cytometer configuration?  Does it fit in my budget?  Are there multiple size options?  Is there support information so I know it's going to work?

So, there you have it.  How much am I willing to spend on this instrument?  Well, I'm willing to buy as much instrument as I need.  If I want a 2-laser, 6-color instrument, I think it has to be priced around $100K.  If I want an 8-laser, 15-FL detector (5 pinholes x 3 detectors) with all the filters I need to look at 45 distinct fluorochromes, I'd say it'd have to be around $350K.

Edit:  A comment above about acoustic focusing may be only partially correct.  Although it is true that acoustic focusing is responsible for focusing the cells and not the sample core stream, this is not how it has been implemented in the Life Technologies Attune Cytometer.  In fact, the Attune has both acoustic focusing for the cells and hydrodynamic focusing for the sample core stream.  When utilizing the low flow rate on the Attune (25ul/min), you can achieve a significant amount of core stream tapering due to a narrowing of the entire stream from a cross-sectional area of 340um (where the cells are being focused by the acoustic wave form) to a 200um cuvette (where laser interrogation occurs).  In this case, the constriction of the entire stream provides the hydrodynamic force needed to narrow the core stream.  When running the sample at a higher flow rate, you'd increase the size of the core stream proportionally as is what happens on non-acoustically focused systems.  However, in the case of the Attune, even at this higher volume flow rate, the cells still remain focused leading to better and more uniform illumination by the lasers.

Wednesday, June 15, 2011

Putting an end to the "Log Wars"

A long time ago, in a laboratory far far away there was a lowly FACScan able to display data on a 4-log scale.  Fast-forward to today, and you'll find some instruments with as many as 7 logs of scale.  That's a huge improvement, right?  Well, maybe not.  The origin of the 4-log scale probably had more to do with the Analog-to-Digital Converters (ADC) being used than the technological needs of the science being done in the 80s.  With the advancements in ADCs in other markets, flow cytometry manufacturers could now include converters with greater bit density and still provide a relatively affordable product.  The standard for many years was the 10-bit ADC, which yields 1024 bins of resolution across the scale.  Spreading these 1024 bins across a 4-log scale appears to give enough resolution while expanding to a reasonable range.  After many years using these solid electronic components, BD completely redesigned the electronic system on its cell sorter (called the BD FACSVantage) to give us the FACSDiVa (or Digital Vantage) architecture.  Now, instead of using traditional ADCs and log amplifiers, BD switched things up by using "high" speed Digital Signal Processors (DSPs) to directly digitize the analog pulse and then do log conversion using look-up tables.  The DSPs converted the linear data at a bin density of 14-bit (16,384 bins) and when the data is log converted, it is upscaled to 18-bit (262144 bins).  Now, with 18-bit data, they are able to display this data on a 5-log scale.  The reason?  Well, if I were forced to guess, I'd say it was a marketing decision to differentiate BD's new line of cytometers from it's old line as well as it's competitors.  With this new 5-log data came with it the "picket fencing" phenomenon, which basically demonstrated that the 18-bit data (which was really 14-bit data) did not have enough bin resolution to display data properly in the 1st decade.  The solution?  Simple, hide the 1st decade and display decades 2 through 5 (right back at a 4-log scale).  Because the BD instruments were so popular, other companies jumped on the bandwagon and thought, well if BD is doing 5-logs then we should do 6-logs or maybe 7-logs.  And that's how we arrived here today, and now I'd like to show you why this is a bad thing.

Let me start with my conclusion first, and then show you how I arrived here.  The figure to the right shows a minimun analog to digital conversion bit density for a given range of log scale.  As you can see, if we wanted to display our data on a 5 log scale, we should have at least a 20-bit ADC. Side note - Bit(eff) means Effective Bit density, which basically takes into account that if you put a 20-bit ADC on your instrument, it probably doesn't actually perform at a full 20-bit.  This is because there is some noise associated with the ADC, which limits the performance of the ADC. /Side note.

So, how did I arrive at this conclusion?  Well first let me demonstrate that bit-density is important with an example.  I created a mock data set of 3 Gaussian distributions (n=1000 data points for each) where the mean of the distributions and the SD were altered such that the populations were overlapping significantly.  I then plotted these distributions on 4 histograms with different quantities of bin resolution ranging from 3-bit to 8-bit.  It's important to remember that this is the exact same data set merely binned differently according to the available resolution.  As you can see, the 3 populations are not at all discernable at the 3-bit range and it's not until we get to the 6-bit histogram that you can start to see the 3 different populations.  Using this information, we can appreciate the importance of having sufficient bin density to resolve distributions from one another.

As an example to a system that might not have enough bin density, I display the following.  Here we have a 20-bit ADC yielding over 1 million bins of resolution to spread across a 6-log scale.  This may sound sufficient, but when we break it down per log, we see that in the first decade, where we have scale values of 1-10, we would only have 11 bins of resolution which would certainly lead to picket fencing and poor resolution of populations in that range.  The Effective bins column shows an example where the noise of the ADC is such that our true bin resolution would be much less than the theoretical 20-bit.

Going through the process and crunching numbers for different scenarios, I conclude that ideally we would like to have on the order of 100s of bins of resolution in the 1st decade.  So, in order to achieve that level on a 6-log scale, we'd actually need to have an 24-bit ADC.  Now, the breakdown would be like what's shown below.  

Take-home message:  First of all, is a 6-log scale really necessary?  For you the answer may be yes, but for most, probably not.  The second question to ask your friendly sales representative is what sort of analog-to-digital conversion is done, and what the bit resolution of the converter is.  It means nothing to have a 7-log scale displaying data from a 10-bit ADC.  No matter how good the optics are you'll never be able to resolve dim populations from unstained cells.  What really matters is having a really good optical system that has high speed, high density electronics that can display all the fine detail of your distributions.  Find an instrument like that, and you have a winner.


Tuesday, May 31, 2011

Throw away your 8-peak beads...now.

Why is it that each booth with a new piece of hardware I walked up to at CYTO had the same set of plots 'demonstrating' how 'sensitive' their instrument is?  I can't tell you how disheartening it is after years of clamoring for a re-definition of instrument 'sensitivity' to see marketing materials littered with histograms proudly displaying 8 peaks.  What does that actually mean?  and Why do instrument manufacturers design instruments around this 'standard'?
Now, I can't totally claim innocence here.  As you can see here, and here, I do use 8-peak beads as part of my panel of instrumentation tests.  However, it's not the only test I run, and I use it more so to dismiss potential problems than single out an instrument that is performing particularly well.  One of the best things 8-peaks can tell you about an instrument is the presence of background due to laser light bleed-through, or possibly a bad filter.  8-peaks are also pretty useful as an all-around alignment bead.  Beyond that, there's not much you can infer from the resolution of 8-peak beads as to the ability of said instrument to resolve dimly stained cells labeled with a particular fluorochrome from unstained cells.  For example, the ability to resolve 8-peaks in the FITC channel doesn't mean a whole lot as to its ability to resolve dim GFP signal from negative cells.  Likewise, the inability to resolve 8-peaks doesn't necessarily mean that channel will perform poorly for a dim fluorescence signal.  Let's look at an example.
I recently had the pleasure of evaluating the 8HT from EMD-Millipore (check out the full review here).  For comparison's sake, I ran the same set of tubes on our Beckman Coulter Gallios.  After collecting the data and doing the requisite comparisons, I noticed how closely the 8-peak data matched between the two, especially in the far red channel where we'd usually detect PECy7.  The first slide below shows the 8-peak data for the PECy7 channel.  The last 3 or 4 peaks are pretty much overlapping with one another.  If we were using the 8-peaks as a metric of 'sensitivity' we'd probably conclude that these two instruments are pretty similar in their ability to resolve dimly fluorescent PECy7 stained cells from unstained cells, right?...right?


Not so fast.  If we stain capture beads with a PECy7 antibody and look at the ability to resolve the 4 peaks that represent different levels of antigen density from each other as well as a blank bead, we can better assess (emphasis on the second syllable, please) the true 'sensitivity' of the two instruments.  Looking below at this figure we can easily see that the Gallios is able to resolve PECy7 much better than the 8HT.  This conclusion matches perfectly with real-world staining examples run on these instruments.  It's obvious that if PECy7 was a pretty darn important conjugate for my panels, you know which instrument I'd be buying (if I could afford it, that is).


So, what's the take-home message here?  Well, it's simple, 8-peak data cannot be used as a surrogate for how well an instrument will detect your panel of fluorochromes.  What should you do?  Again, simple:  make sure YOU run YOUR favorite flavors of fluors on the instrument you're evaluating to give you an idea of how well it's set up for YOUR experiments.  You can certainly do this by staining your cell samples of choice, or you could use a multi-peak capture bead to look at resolution.  And if you want to quantitate this a bit more, you could extrapolate the peaks down to an area just above the blank bead to determine precisely how dim of a population you'd be able to resolve.


Tuesday, May 17, 2011

EMD-Millipore 8HT Review

In my quest to find a mid-range cytometer to replace my ailing FACSCantos, I've come upon the 8HT from EMD-Millipore (whom I'll probably just call Millipore for now, or maybe even Guava at times). The 8HT is a 2 laser, 8-parameter cytometer (2 Scatter and 6 Fluorescence, setup in a 4-2 configuration).  It represents the "top-of-the-line" instrument in the field of 8 cytometers that vary in their number of lasers, detectors and the absence/presence of a microtiter plate loader.  The 8HT can accept either a 96 well plate or 10, 1.5mL microfuge tubes.  There are also a set of 6 tube slots for various washing/rinsing purposes.  There are a few unique features to this instrument which I'll briefly describe below before getting into the data.

All of the legacy Guava instruments and the new Millipore additions share the same microcapillary fluidics system.  Whereas in flow-cell containing instruments, a sheath fluid is funneled through a conical shaped flow-cell where it creates the hydrodynamic force used to align the sample core stream through the laser interrogation point, here there is no sheath fluid.  The microcapillary system is basically a clear straw through which the sample is drawn, and the microcapillary walls provide the physical barrier to align the sample, essentially replacing the sheath fluid.  This basically means there's no PBS tanks to fill, and no giant waste container to dump down the sink.  Also, since the sample core cannot expand in diameter to increase event rate like it would in a hydrodynamically focused system, the way in which you increase event rate is by literally increasing the speed at which the fluid is drawn through the capillary.  With the capillary system, you do get a bonus in absolute counts for everything.

A second unique feature of the system is the modulated laser setup they've implemented to get around the need for separate pinholes and laser delays.  Basically, the 488nm and 640nm laser lines are modulated out-of-phase with each other at a high frequency so that red fluorescence emitting from the cell while the blue laser is exciting is sensed separately from red fluorescence emitting from the cell while the red laser is exciting.  I was pretty skeptical at first, but this works surprisingly well.  For example, APC fluorescence was pretty well excluded from the Red1 channel (Blue excitation/Red emission).  What makes this remarkable is that Red1 and Red2 are actually the same detector, but because of the modulation, the emission is able to be separated out cleanly.  

The software, InCyte was pretty good.  The thing that bugs me a little is the mere presence of the old Guava modules.  The 8HT software, in general seems a bit schizophrenic.  You can jump back and forth between a green background Guava software to a grey background InCyte.  I think it would be less confusing if there were just one platform to use.  The InCyte software is pretty capable on its own, so I can't see what's the use of the Guava software.  I'm not one to use canned application-specific templates, so that makes anything with a green background pretty much useless.  There are a few unique analysis tricks built-in as well, which show your data in a heat map-like graphic.  However, probably my most favorite feature of the software is something fairly minor.  To adjust the threshold on FSC, you can simply drag a red dotted line up and down the scale.  There is no confusion on where the threshold is set.

So far, so good, right?  Well, here's where things fall apart - Data.  Like many of the other units I've tested in this range, their fluorescence resolution seems to be lacking.  I'd put the 8HT pretty much on-par with the rest, but let's take a look at some figures.  I ran my standard battery of tests including, Single Peak UltraRainbows (to get a glimpse at alignment via the CV), 8-peak rainbows (to assure a certain level of dynamic range and resolution), PI stained CENs (to look at linearity as well as well-to-well carryover), and my 'gold-standard' dim population resolution (using antibody stained capture beads).  This time, to mix things up a bit, I chose to run the EXACT same samples on our Gallios, and just to make things absolutely fair, the samples were run on the 8HT first and then on the Gallios (just in case they started to deteriorate over time).

Single peak URFP, showing CVs of the fluorescence channels on the 8HT versus the Gallios.


8HT URFP Bead CV
Gallios URFP Bead CV


Next up, the ubiquitous 8-peak Rainbow Beads.

8HT 8-peak Rainbow Bead Resolution

Gallios 8-peak Rainbow Bead Resolution
PI Stained CENs:  Here we notice a problem with the 8HT.  My guess is that the unbound PI in solution is too much for the system to handle, and the detector is being swamped by light.  Obviously, this could be alleviated by titrating the PI out, but as you can see below, the Gallios' baseline restoration has no problem with the unbound PI.  If you think about it, in a capillary system, the amount of sample fluid that is illuminated along with the cell is much higher than in a hydrodynamically focused system running at a narrow core stream, so unbound fluorochrome in solution surrounding the cells has a huge impact on background.  Keep this in mind when looking at the Dim population resolution data.  Also, for carryover, I'm simply looking for cells in the subsequent well to have been stained by PI carried-over from the prior well.  In this case, carryover appears to be less than 1:10,000.


For the Dim Population test, antibody binding beads stained with different fluorescently labelled CD4 antibodies were run on the 8HT at the 'very low' flow rate and the 'medium' flow rate.  There are suppose to be 4 stained peaks (blue) and an unstained peak (grey).  The lowest stained peak represents about 2500 bound antibodies (CD4 on Human PBMCs is about 50,000 binding sites).  Here, we get a really great picture of the background issues.  When looking at a blank bead by itself, the background is pretty low.  However, once you have some fluorescence present, the background peaks merge together and offer no resolution.  This effect is enhanced when you increase the flow rate.  Again, the exact same samples are run on the Gallios.


So, as I've said many times, the convenience that these systems offer may be nice, but I'm not sure it outweighs the lack of fluorescence resolution.  I'm sure things could be optimized so that this system would perform better, but I'll always come back to the fact that we don't run into these problems on our LSRII, Fortessa, Gallios, or even our Cantos, Caliburs and Scans.  What's the difference?  Hydrodyanmically focused streams with gel-coupled collection optics, high-quality/high-powered lasers, and bit-dense/fast sampling electronics.  The quest continues...

Monday, April 18, 2011

Display Transformation and FlowJo: Confused? Read on.

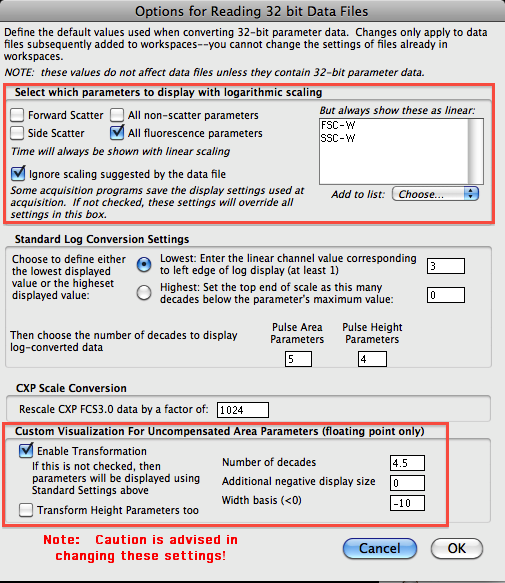
I'm not going to discuss the merits of transforming your log-scaled fluorescence flow cytometry data;  I'll leave that to the professionals.  What I will try to elucidate here is how I tweak the transformation using FlowJo (Mac version 9.3, sorry Windows people).  For simplicity, I will use the factory default preferences to start.  It's important to note that if you're on a shared computer, the preferences could have been changed, which may result in some funky things happening.  It's probably best to get a set of preferences that you like, and save them so each time you can pull up your preferences.  The preferences that matter for this are the Compensation section in the workspace tab (red box) and the "Define" button for  32-bit data, which will open the Options window for these type of data.
There are basically 3 things you can modify when adjusting the display transformation.  They are the Number of decades, Additional negative display size and the Width basis. The Number of decades controls, to a large extent, how many decades of dynamic range is shown for events greater than zero. By default, this is 4.5--even if you export 5.5 decade data, use 4-4.5, otherwise too much visual space is devoted to the lowest decade. Additional negative display size controls, to a large extent, how much visual space to devote to events that have values less than zero. Since we are displaying data on a log scale, zero is not defined. So, there needs to be a way to display data around zero that makes sense. This is what's at the heart of the biexponential display. Near zero, the log scale becomes linear so that zero can be defined, and then goes back to log when safely in the negative realm. The number of channels around zero that are transformed into the linear realm is defined by the width basis. By default, FACSDiVa uses a width basis of -100, whereas FlowJo's default is -10.

So, how does this affect your data?  Well let's take a look at an example.  FITC and PE stained capture beads were run on a FACSCanto and exported in the FCS 3.0 format.  No compensation was done at the instrument, and single stained controls were used to compensate the data in FlowJo.  Below is the uncompensated data file as well as a compensated file using the defaults that were currently applied.  

Looks pretty good, but let's take a look at some simple tweaks.  For this, we'll go to the Platform menu, then Biexponential Transformation and then Manually Specify Transformation, which will bring open the window to edit the transformation settings.

Again, we have the option to change the width basis, Positive decades and Additional Negative Decades.  Let's assume we're not going to change the Positive decades, so we'll focus on what the width basis and negative decades will make.  Below are the plots shown at each of the width basis presets.  As you can see, the main affect is squishing the data closer together around the zero point.  Good to get data off the axis, but you can easily take it too far and end up reducing your ability to resolve dimly stained cells from unstained cells.

The question then is how much transformation do you apply?  One strategy that I like to employ is to try and visualize this better with a contour.  The goal is to remove the bimodal-like profile of the populations as they cross the zero point.  Once I'm able to do that, I then increase the amount of negative log space so that most of the data is not on the axis.  For example, below I show a -10 width basis, 1 additional negative log in a contour plot.  In the brightest peaks, it is easy to see a pronounced dumbbell shaped population straddling the zero point.  If I modify the width basis a bit to get rid of the dumbbell shape, and then reduce the additional negative space to remove extraneous white space, I get a profile like the one on the right.  Notice that each axis is done separately and can have different width basis and negative logs to achieve the best transformation.  


Once all is said and done, I now have a well transformed plot that is worthy of publication.  Below is the original uncompensated plot, the default transformation, and the modified transformation.


A few tweaks and a bit of trial and error is all you need to get visually pleasing plots that will actually help you make better decisions in terms of region drawing and data interpretation.  So, please feel free to play around with these settings and see how well you can transform.