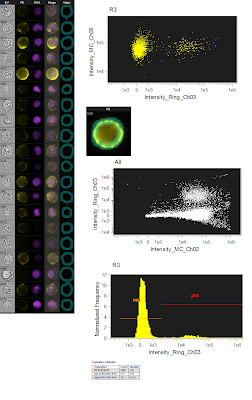
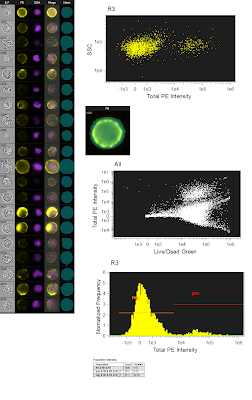
It's a really simple example, but in short it involves a surface marker (coupled to PE), a Live/Dead dye (Green) and a Nuclear dye (Violet). By conventional flow cytometry, the PE signal was pretty weak and the user was skeptical that the staining was "real." So, the idea was to make sure the cells were live (Green low/neg), were actually cells (Violet pos) and had surface staining of PE. After going through the normal groups of gating, it came time to look at the PE signal. Surprisingly, it wasn't bad at all (especially with the 561nm laser cranked up to 200mW), however there were some dimmer PE+ cells that were hanging out a bit too close to the negative.
I remember having a discussion with other people in the lab about using carefully calculated masks to pull out the membrane staining and completely removing the cytoplasmic and/or nuclear background which should bring the negative population pretty much down to zero while retaining the specific PE positive fluorescence. This procedure is actually pretty simple so I'll briefly explain it, and if this whole concept of image masking is foreign to you, just think of masks as parts of a cell defined by morphology within which you're going to measure fluorescence. This is very different from flow cytometry where you can only measure fluorescence from the entire cell regardless of where that fluorescence is coming from. With this data, I'm creating a membrane mask, which basically looks like a ring encompassing the outside of the cell. This should retain most of the specific PE fluorescence and remove both background from intracellular autofluorescence, but also background from the nuclear dye and live/dead dye. The figures below demonstrate these findings.
 The figure to the left is the originally analyzed data. On the far left is just a gallery of images that show the different fluorescence (the green live/dead wasn't show since dead cells were gated out). The top dot plot is a simple SSC/PE scatter plot to show the distribution of the negative and positives. The image just below is showing the mask used (bluish semitransparent shape overlaying the PE image). Below that is the ungated population showing the Live/Dead Green fluorescence spilling into the PE channel using the whole cell mask. And lastly, a histogram showing the PE Fluorescence. Altogether, a pretty straightforward analysis. However, I wanted to see what would happen if I restricted the PE mask to only the membrane area, so that is what is shown in the figure below. Now, it's important to note that this is the exact same data file, analyzing the exact same group of cells. The only thing changed here is the mask on PE, which is now shown as a ring overlaying the membrane of the cell. If you now look at the SSC/PE scatter plot at the top, you can see the dramatic tightening of the negative population, which implies a reduction of the high autofluorescence cells that were trailing to the right of the negative population in the total cell mask. Another benefit of this restrictive masking strategy was the reduction in the spillover of the green dye into the PE channel as shown in the ungated Live/Dead Green versus PE plot. And lastly, when you look at the histogram, you can see unequivocally the increase in separation between the negatives and positives. To drive the point home a bit more, we can overlay the two histograms so you can see exactly how they match up. Notice that there is a reduction in the intensity of the positive population as well, but this is likely a similar reduction in background fluorescence as is seen in the negative population. The key here and really in all of flow cytometry is RESOLUTION. This is, in fact, what most people are really thinking about when they say 'sensitivity.'
 So, can we confirm the original statement here about these imaging cytometers being the most sensitive cytometers available? Well, I'm not sure I'm ready to crown this instrument as the winner just yet, but at least in some circumstances, the ability to only analyze the part of the cell that is actually stained or not stained could prove to be an extremely vital tool especially if you need to resolve dimly stained cells from unstained cells.


The Imagestream certainly has capabilities that that of conventional cytometer does not. Therefore I support and always have that you should never always depend on data from one type of application/instrument and should always complement it with that of another to develop a well rounded publication and truly understand what is occuring in your experiment. Good research in not "1-dimensional".
ReplyDeleteI certainly agree with your comments, and I believe Amnis has been pretty clear that the ImageStream is not a conventional flow cytometer. I guess I'm mostly looking at marketing and perception of the Flowsight as an alternative to a flow cytometer of similar capability and price-point. The claims that were being made and the data used to support such claims (i.e. 8-peak bead resolution) are not really valid. If I were marketing the instrument, I'd focus most of my attention on the world of information obtained with the addition of imagery and how that can allow a researcher to make more definitive conclusions for some applications. Thanks for the Comment!
ReplyDeleteHi Ryan,
DeleteThanks for the writeup on this, sorry I'm so late to the party. I understand your dissatisfaction with 8 peak Rainbow beads as sensitivity standards but they do have several useful characteristics:
1. They have a true unlabeled population and a closely-spaced dim population. It can be surprisingly difficult to find a truly "dark" bead. A lot of unlabelled beads that we've looked at are actually dimly fluorescent for one reason or another.
2. The brightest population in the set can be adjusted to lie just below the saturation point of the detector, allowing measurement of sensitivity at the low end using settings that provide maximum dynamic range. Any system can look good at the low end by cranking up detector voltage and/or laser power but by constraining the high end to lie below saturation, you get an apples-to-apples means of measuring sensitivity across instruments under the most demanding conditions.
3. The broadband ("white") emission of these beads makes them very convenient to use for measuring deep red sensitivity with 488 excitation without having to resort to things like home-brew beads capturing PE-Cy7 labeled antibodies, which can be difficult to reproduce.
As you point out, we're not shy about the claims we make for the sensitivity of our instruments, but always with data to back them up. I'd be very interested to see more results from your independent cross-platform testing.
Best,
David
Thanks for your thoughts David. In principle, I agree. If I could make only one comment it would be this: End-users need to test their panel of fluorochromes empirically to determine if they can in fact achieve better resolution on the ImageStream (or FlowSight). Resolving from blank using analogous dyes may not directly correlate with resolving stained cells from autofluorescence. This empowerment and encouragement to end-users of these technologies is really the point of my pontificating.
Delete